Citibank 2013 Annual Report Download - page 98
Download and view the complete annual report
Please find page 98 of the 2013 Citibank annual report below. You can navigate through the pages in the report by either clicking on the pages listed below, or by using the keyword search tool below to find specific information within the annual report.-
 1
1 -
2
-
3
-
4
-
5
-
6
-
7
-
8
-
9
-
10
-
11
-
12
-
13
-
14
-
15
-
16
-
17
-
18
-
19
-
20
-
21
-
22
-
23
-
24
-
25
-
26
-
27
-
28
-
29
-
30
-
31
-
32
-
33
-
34
-
35
-
36
-
37
-
38
-
39
-
40
-
41
-
42
-
43
-
44
-
45
-
46
-
47
-
48
-
49
-
50
-
51
-
52
-
53
-
54
-
55
-
56
-
57
-
58
-
59
-
60
-
61
-
62
-
63
-
64
-
65
-
66
-
67
-
68
-
69
-
70
-
71
-
72
-
73
-
74
-
75
-
76
-
77
-
78
-
79
-
80
-
81
-
82
-
83
-
84
-
85
-
86
-
87
-
 88
88 -
 89
89 -
 90
90 -
 91
91 -
 92
92 -
 93
93 -
 94
94 -
 95
95 -
 96
96 -
 97
97 -
 98
98 -
 99
99 -
 100
100 -
 101
101 -
 102
102 -
 103
103 -
 104
104 -
 105
105 -
 106
106 -
 107
107 -
 108
108 -
109
-
110
-
111
-
112
-
113
-
114
-
115
-
116
-
117
-
118
-
119
-
120
-
121
-
122
-
123
-
124
-
125
-
126
-
127
-
128
-
129
-
130
-
131
-
132
-
133
-
134
-
135
-
136
-
137
-
138
-
139
-
140
-
141
-
142
-
143
-
144
-
145
-
146
-
147
-
148
-
149
-
150
-
151
-
152
-
153
-
154
-
155
-
156
-
157
-
158
-
159
-
160
-
161
-
162
-
163
-
164
-
165
-
166
-
167
-
168
-
169
-
170
-
171
-
172
-
173
-
174
-
175
-
176
-
177
-
178
-
179
-
180
-
181
-
182
-
183
-
184
-
185
-
186
-
187
-
188
-
189
-
190
-
191
-
192
-
193
-
194
-
195
-
196
-
197
-
198
-
199
-
200
-
201
-
202
-
203
-
204
-
205
-
206
-
207
-
208
-
209
-
210
-
211
-
212
-
213
-
214
-
215
-
216
-
217
-
218
-
219
-
220
-
221
-
222
-
223
-
224
-
225
-
226
-
227
-
228
-
229
-
230
-
231
-
232
-
233
-
234
-
235
-
236
-
237
-
238
-
239
-
240
-
241
-
242
-
243
-
244
-
245
-
246
-
247
-
248
-
249
-
250
-
251
-
252
-
253
-
254
-
255
-
256
-
257
-
258
-
259
-
260
-
261
-
262
-
263
-
264
-
265
-
266
-
267
-
268
-
269
-
270
-
271
-
272
-
273
-
274
-
275
-
276
-
277
-
278
-
279
-
280
-
281
-
282
-
283
-
284
-
285
-
286
-
287
-
288
-
289
-
290
-
291
-
292
-
293
-
294
-
295
-
296
-
297
-
298
-
299
-
300
-
301
-
302
-
303
-
304
-
305
-
306
-
307
-
308
-
309
-
310
-
311
-
312
-
313
-
314
-
315
-
316
-
317
-
318
-
319
-
320
-
321
-
322
-
323
-
324
-
325
-
326
-
327
-
328
-
329
-
330
-
331
-
332
-
333
-
334
-
335
-
336
-
337
-
338
-
339
-
340
-
341
-
342
 |
 |

80
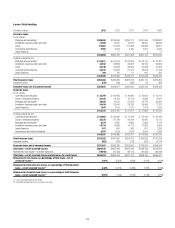
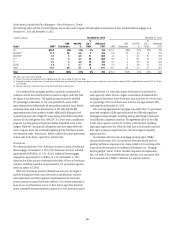
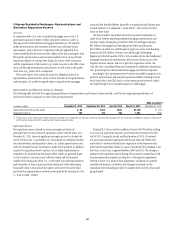
The table below summarizes Citigroup’s other real estate owned (OREO) assets as of the periods indicated. This represents the carrying value of all real estate
property acquired by foreclosure or other legal proceedings when Citi has taken possession of the collateral.
In millions of dollars 2013 2012 2011 2010 2009
OREO
Citicorp $ 79 $ 49 $ 86 $ 840 $ 885
Citi Holdings 338 391 480 863 615
Total OREO $ 417 $ 440 $ 566 $ 1,703 $ 1,500
North America $ 305 $ 299 $ 441 $ 1,440 $ 1,294
EMEA 59 99 73 161 121
Latin America 47 40 51 47 45
Asia 62 1 55 40
Total OREO $ 417 $ 440 $ 566 $ 1,703 $ 1,500
Other repossessed assets $ — $ 1 $ 1 $ 28 $ 73
Non-accrual assets—Total Citigroup
Corporate non-accrual loans $ 1,908 $ 2,333 $ 3,236 $ 8,620 $13,479
Consumer non-accrual loans (1) 7,049 9,196 7,832 10,787 18,261
Non-accrual loans (NAL) $ 8,957 $11,529 $11,068 $19,407 $31,740
OREO 417 440 566 1,703 1,500
Other repossessed assets —1 1 28 73
Non-accrual assets (NAA) $ 9,374 $11,970 $11,635 $21,138 $33,313
NAL as a percentage of total loans 1.34% 1.76% 1.71% 2.99% 5.37%
NAA as a percentage of total assets 0.50 0.64 0.62 1.10 1.79
Allowance for loan losses as a percentage of NAL (2) 219 221 272 209 114
Non-accrual assets—Total Citicorp 2013 2012 2011 2010 2009
Non-accrual loans (NAL) $ 3,791 $ 4,096 $ 4,018 $ 4,909 $ 5,353
OREO 79 49 86 840 885
Other repossessed assets N/A N/A N/A N/A N/A
Non-accrual assets (NAA) $ 3,870 $ 4,145 $ 4,104 $ 5,749 $ 6,238
NAA as a percentage of total assets 0.22% 0.23% 0.23% 0.25% 0.24%
Allowance for loan losses as a percentage of NAL (2) 348 357 416 456 232
Non-accrual assets—Total Citi Holdings
Non-accrual loans (NAL) (1) $5,166 $ 7,433 $ 7,050 $14,498 $26,387
OREO 338 391 480 863 615
Other repossessed assets N/A N/A N/A N/A N/A
Non-accrual assets (NAA) $ 5,504 $ 7,824 $ 7,530 $15,361 $27,002
NAA as a percentage of total assets 4.70% 5.02% 3.35% 4.91% 5.90%
Allowance for loan losses as a percentage of NAL (2) 125 146 190 126 90
(1) During 2012, there was an increase in Consumer non-accrual loans in North America of approximately $1.5 billion as a result OCC guidance regarding mortgage loans where the borrower has gone through Chapter 7
bankruptcy. Additionally, during 2012, there was an increase in non-accrual Consumer loans in North America of $0.8 billion related to a reclassification from accrual to non-accrual status of home equity loans where
the related residential first mortgage was 90 days or more past due. For additional information on each of these items, see footnote 2 to the “Non-Accrual Loans” table above.
(2) The allowance for loan losses includes the allowance for Citi’s credit card portfolios and purchased distressed loans, while the non-accrual loans exclude credit card balances (with the exception of certain international
portfolios) and purchased distressed loans as these continue to accrue interest until charge-off.
N/A Not available at the Citicorp or Citi Holdings level.