Citibank 2013 Annual Report Download - page 226
Download and view the complete annual report
Please find page 226 of the 2013 Citibank annual report below. You can navigate through the pages in the report by either clicking on the pages listed below, or by using the keyword search tool below to find specific information within the annual report.-
 1
1 -
2
-
3
-
4
-
5
-
6
-
7
-
8
-
9
-
10
-
11
-
12
-
13
-
14
-
15
-
16
-
17
-
18
-
19
-
20
-
21
-
22
-
23
-
24
-
25
-
26
-
27
-
28
-
29
-
30
-
31
-
32
-
33
-
34
-
35
-
36
-
37
-
38
-
39
-
40
-
41
-
42
-
43
-
44
-
45
-
46
-
47
-
48
-
49
-
50
-
51
-
52
-
53
-
54
-
55
-
56
-
57
-
58
-
59
-
60
-
61
-
62
-
63
-
64
-
65
-
66
-
67
-
68
-
69
-
70
-
71
-
72
-
73
-
74
-
75
-
76
-
77
-
78
-
79
-
80
-
81
-
82
-
83
-
84
-
85
-
86
-
87
-
88
-
89
-
90
-
91
-
92
-
93
-
94
-
95
-
96
-
97
-
98
-
99
-
100
-
101
-
102
-
103
-
104
-
105
-
106
-
107
-
108
-
109
-
110
-
111
-
112
-
113
-
114
-
115
-
116
-
117
-
118
-
119
-
120
-
121
-
122
-
123
-
124
-
125
-
126
-
127
-
128
-
129
-
130
-
131
-
132
-
133
-
134
-
135
-
136
-
137
-
138
-
139
-
140
-
141
-
142
-
143
-
144
-
145
-
146
-
147
-
148
-
149
-
150
-
151
-
152
-
153
-
154
-
155
-
156
-
157
-
158
-
159
-
160
-
161
-
162
-
163
-
164
-
165
-
166
-
167
-
168
-
169
-
170
-
171
-
172
-
173
-
174
-
175
-
176
-
177
-
178
-
179
-
180
-
181
-
182
-
183
-
184
-
185
-
186
-
187
-
188
-
189
-
190
-
191
-
192
-
193
-
194
-
195
-
196
-
197
-
198
-
199
-
200
-
201
-
202
-
203
-
204
-
205
-
206
-
207
-
208
-
209
-
210
-
211
-
212
-
213
-
214
-
215
-
 216
216 -
 217
217 -
 218
218 -
 219
219 -
 220
220 -
 221
221 -
 222
222 -
 223
223 -
 224
224 -
 225
225 -
 226
226 -
 227
227 -
 228
228 -
 229
229 -
 230
230 -
 231
231 -
 232
232 -
 233
233 -
 234
234 -
 235
235 -
 236
236 -
237
-
238
-
239
-
240
-
241
-
242
-
243
-
244
-
245
-
246
-
247
-
248
-
249
-
250
-
251
-
252
-
253
-
254
-
255
-
256
-
257
-
258
-
259
-
260
-
261
-
262
-
263
-
264
-
265
-
266
-
267
-
268
-
269
-
270
-
271
-
272
-
273
-
274
-
275
-
276
-
277
-
278
-
279
-
280
-
281
-
282
-
283
-
284
-
285
-
286
-
287
-
288
-
289
-
290
-
291
-
292
-
293
-
294
-
295
-
296
-
297
-
298
-
299
-
300
-
301
-
302
-
303
-
304
-
305
-
306
-
307
-
308
-
309
-
310
-
311
-
312
-
313
-
314
-
315
-
316
-
317
-
318
-
319
-
320
-
321
-
322
-
323
-
324
-
325
-
326
-
327
-
328
-
329
-
330
-
331
-
332
-
333
-
334
-
335
-
336
-
337
-
338
-
339
-
340
-
341
-
342
 |
 |

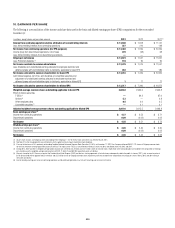
208
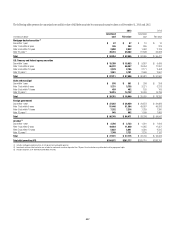
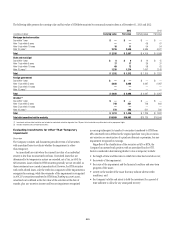
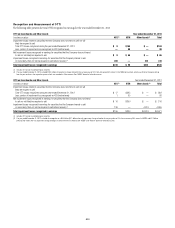
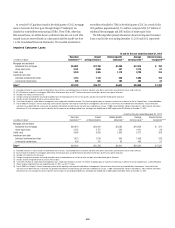
Debt Securities Held-to-Maturity
The carrying value and fair value of debt securities HTM at December 31, 2013 and 2012 were as follows:
In millions of dollars
Amortized
cost (1)
Net unrealized
losses
recognized in
AOCI
Carrying
value (2)
Gross
unrealized
gains
Gross
unrealized
losses
Fair
value
December 31, 2013
Debt securities held-to-maturity
Mortgage-backed securities (3)
Prime $ 72 $ 16 $ 56 $ 5 $ 2 $ 59
Alt-A 1,379 287 1,092 449 263 1,278
Subprime 2 — 2 1 — 3
Non-U.S. residential 1,372 206 1,166 60 20 1,206
Commercial 10 — 10 1 — 11
Total mortgage-backed securities $ 2,835 $ 509 $ 2,326 $ 516 $ 285 $ 2,557
State and municipal $ 1,394 $ 62 $ 1,332 $ 50 $ 70 $ 1,312
Foreign government 5,628 — 5,628 70 10 5,688
Corporate 818 78 740 111 — 851
Asset-backed securities (3) 599 26 573 22 10 585
Total debt securities held-to-maturity $11,274 $ 675 $10,599 $ 769 $ 375 $10,993
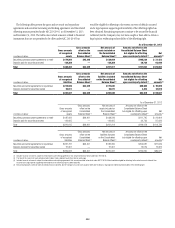
December 31, 2012
Debt securities held-to-maturity
Mortgage-backed securities (3)
Prime $ 258 $ 49 $ 209 $ 30 $ 4 $ 235
Alt-A 2,969 837 2,132 653 250 2,535
Subprime 201 43 158 13 21 150
Non-U.S. residential 2,488 401 2,087 50 81 2,056
Commercial 123 — 123 1 2 122
Total mortgage-backed securities $ 6,039 $ 1,330 $ 4,709 $ 747 $ 358 $ 5,098
State and municipal $ 1,278 $ 73 $ 1,205 $ 89 $ 37 $ 1,257
Foreign government 2,987 — 2,987 — — 2,987
Corporate 829 103 726 73 — 799
Asset-backed securities (3) 529 26 503 8 8 503
Total debt securities held-to-maturity $11,662 $ 1,532 $10,130 $ 917 $ 403 $10,644
(1) For securities transferred to HTM from Trading account assets, amortized cost is defined as the fair value of the securities at the date of transfer plus any accretion income and less any impairments recognized in
earnings subsequent to transfer. For securities transferred to HTM from AFS, amortized cost is defined as the original purchase cost, plus or minus any accretion or amortization of a purchase discount or premium, less
any impairment recognized in earnings.
(2) HTM securities are carried on the Consolidated Balance Sheet at amortized cost, plus or minus any unamortized unrealized gains and losses recognized in AOCI prior to reclassifying the securities from AFS to HTM. The
changes in the values of these securities are not reported in the financial statements, except for other-than-temporary impairments. For HTM securities, only the credit loss component of the impairment is recognized
in earnings, while the remainder of the impairment is recognized in AOCI.
(3) The Company invests in mortgage-backed and asset-backed securities. These securitizations are generally considered VIEs. The Company’s maximum exposure to loss from these VIEs is equal to the carrying amount
of the securities, which is reflected in the table above. For mortgage-backed and asset-backed securitizations in which the Company has other involvement, see Note 22 to the Consolidated Financial Statements.
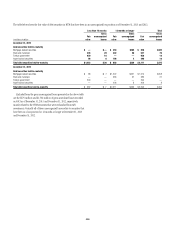
The Company has the positive intent and ability to hold these securities
to maturity absent any unforeseen further significant changes in
circumstances, including deterioration in credit or with regard to regulatory
capital requirements.
The net unrealized losses classified in AOCI relate to debt securities
previously reclassified from AFS investments to HTM investments.
Additionally, for HTM securities that have suffered credit impairment,
declines in fair value for reasons other than credit losses are recorded in
AOCI, while credit-related impairment is recognized in earnings. The AOCI
balance for HTM securities is amortized over the remaining life of the related
securities as an adjustment of yield in a manner consistent with the accretion
of discount on the same debt securities. This will have no impact on the
Company’s net income because the amortization of the unrealized holding
loss reported in equity will offset the effect on interest income of the accretion
of the discount on these securities.