Citibank 2013 Annual Report Download - page 47
Download and view the complete annual report
Please find page 47 of the 2013 Citibank annual report below. You can navigate through the pages in the report by either clicking on the pages listed below, or by using the keyword search tool below to find specific information within the annual report.-
 1
1 -
2
-
3
-
4
-
5
-
6
-
7
-
8
-
9
-
10
-
11
-
12
-
13
-
14
-
15
-
16
-
17
-
18
-
19
-
20
-
21
-
22
-
23
-
24
-
25
-
26
-
27
-
28
-
29
-
30
-
31
-
32
-
33
-
34
-
35
-
36
-
 37
37 -
 38
38 -
 39
39 -
 40
40 -
 41
41 -
 42
42 -
 43
43 -
 44
44 -
 45
45 -
 46
46 -
 47
47 -
 48
48 -
 49
49 -
 50
50 -
 51
51 -
 52
52 -
 53
53 -
 54
54 -
 55
55 -
 56
56 -
 57
57 -
58
-
59
-
60
-
61
-
62
-
63
-
64
-
65
-
66
-
67
-
68
-
69
-
70
-
71
-
72
-
73
-
74
-
75
-
76
-
77
-
78
-
79
-
80
-
81
-
82
-
83
-
84
-
85
-
86
-
87
-
88
-
89
-
90
-
91
-
92
-
93
-
94
-
95
-
96
-
97
-
98
-
99
-
100
-
101
-
102
-
103
-
104
-
105
-
106
-
107
-
108
-
109
-
110
-
111
-
112
-
113
-
114
-
115
-
116
-
117
-
118
-
119
-
120
-
121
-
122
-
123
-
124
-
125
-
126
-
127
-
128
-
129
-
130
-
131
-
132
-
133
-
134
-
135
-
136
-
137
-
138
-
139
-
140
-
141
-
142
-
143
-
144
-
145
-
146
-
147
-
148
-
149
-
150
-
151
-
152
-
153
-
154
-
155
-
156
-
157
-
158
-
159
-
160
-
161
-
162
-
163
-
164
-
165
-
166
-
167
-
168
-
169
-
170
-
171
-
172
-
173
-
174
-
175
-
176
-
177
-
178
-
179
-
180
-
181
-
182
-
183
-
184
-
185
-
186
-
187
-
188
-
189
-
190
-
191
-
192
-
193
-
194
-
195
-
196
-
197
-
198
-
199
-
200
-
201
-
202
-
203
-
204
-
205
-
206
-
207
-
208
-
209
-
210
-
211
-
212
-
213
-
214
-
215
-
216
-
217
-
218
-
219
-
220
-
221
-
222
-
223
-
224
-
225
-
226
-
227
-
228
-
229
-
230
-
231
-
232
-
233
-
234
-
235
-
236
-
237
-
238
-
239
-
240
-
241
-
242
-
243
-
244
-
245
-
246
-
247
-
248
-
249
-
250
-
251
-
252
-
253
-
254
-
255
-
256
-
257
-
258
-
259
-
260
-
261
-
262
-
263
-
264
-
265
-
266
-
267
-
268
-
269
-
270
-
271
-
272
-
273
-
274
-
275
-
276
-
277
-
278
-
279
-
280
-
281
-
282
-
283
-
284
-
285
-
286
-
287
-
288
-
289
-
290
-
291
-
292
-
293
-
294
-
295
-
296
-
297
-
298
-
299
-
300
-
301
-
302
-
303
-
304
-
305
-
306
-
307
-
308
-
309
-
310
-
311
-
312
-
313
-
314
-
315
-
316
-
317
-
318
-
319
-
320
-
321
-
322
-
323
-
324
-
325
-
326
-
327
-
328
-
329
-
330
-
331
-
332
-
333
-
334
-
335
-
336
-
337
-
338
-
339
-
340
-
341
-
342
 |
 |

29
related to accrual loans, core lending revenues increased 35%, primarily
driven by growth in the Corporate loan portfolio and improved spreads in
most regions.
• Private Bank revenues increased 8%, driven by growth in client assets as a
result of client acquisition and development efforts in Citi’s targeted client
segments. Deposit volumes, investment assets under management and
loans all increased, while pricing and product mix optimization initiatives
offset underlying spread compression across products.
Expenses decreased 4%. Excluding repositioning charges of $349 million
in 2012 (including $237 million in the fourth quarter of 2012) compared to
$267 million in 2011, expenses also decreased 4%, driven by efficiency savings
from ongoing re-engineering programs and lower compensation costs.
Provisions increased 5% to $122 million, primarily reflecting lower loan
loss reserve releases, partially offset by lower net credit losses, both due to
portfolio stabilization.
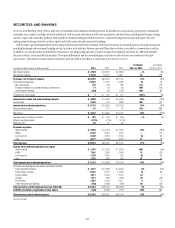
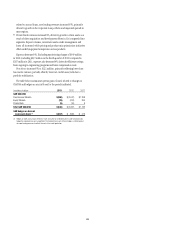
The table below summarizes pretax gains (losses) related to changes in
CVA/DVA and hedges on accrual loans for the periods indicated.
In millions of dollars 2013 2012 2011
S&B CVA/DVA
Fixed Income Markets $(300) $(2,047) $1,368
Equity Markets (39) (424) 355
Private Bank (6) (16) 9
Total S&B CVA/DVA $(345) $(2,487) $1,732
S&B Hedges on Accrual
Loans gain (loss) (1) $(287) $ (698) $ 519
(1) Hedges on S&B accrual loans reflect the mark-to-market on credit derivatives used to economically
hedge the corporate loan accrual portfolio. The fixed premium cost of these hedges is netted against
the core lending revenues to reflect the cost of the credit protection.