Citibank 2013 Annual Report Download - page 265
Download and view the complete annual report
Please find page 265 of the 2013 Citibank annual report below. You can navigate through the pages in the report by either clicking on the pages listed below, or by using the keyword search tool below to find specific information within the annual report.-
 1
1 -
2
-
3
-
4
-
5
-
6
-
7
-
8
-
9
-
10
-
11
-
12
-
13
-
14
-
15
-
16
-
17
-
18
-
19
-
20
-
21
-
22
-
23
-
24
-
25
-
26
-
27
-
28
-
29
-
30
-
31
-
32
-
33
-
34
-
35
-
36
-
37
-
38
-
39
-
40
-
41
-
42
-
43
-
44
-
45
-
46
-
47
-
48
-
49
-
50
-
51
-
52
-
53
-
54
-
55
-
56
-
57
-
58
-
59
-
60
-
61
-
62
-
63
-
64
-
65
-
66
-
67
-
68
-
69
-
70
-
71
-
72
-
73
-
74
-
75
-
76
-
77
-
78
-
79
-
80
-
81
-
82
-
83
-
84
-
85
-
86
-
87
-
88
-
89
-
90
-
91
-
92
-
93
-
94
-
95
-
96
-
97
-
98
-
99
-
100
-
101
-
102
-
103
-
104
-
105
-
106
-
107
-
108
-
109
-
110
-
111
-
112
-
113
-
114
-
115
-
116
-
117
-
118
-
119
-
120
-
121
-
122
-
123
-
124
-
125
-
126
-
127
-
128
-
129
-
130
-
131
-
132
-
133
-
134
-
135
-
136
-
137
-
138
-
139
-
140
-
141
-
142
-
143
-
144
-
145
-
146
-
147
-
148
-
149
-
150
-
151
-
152
-
153
-
154
-
155
-
156
-
157
-
158
-
159
-
160
-
161
-
162
-
163
-
164
-
165
-
166
-
167
-
168
-
169
-
170
-
171
-
172
-
173
-
174
-
175
-
176
-
177
-
178
-
179
-
180
-
181
-
182
-
183
-
184
-
185
-
186
-
187
-
188
-
189
-
190
-
191
-
192
-
193
-
194
-
195
-
196
-
197
-
198
-
199
-
200
-
201
-
202
-
203
-
204
-
205
-
206
-
207
-
208
-
209
-
210
-
211
-
212
-
213
-
214
-
215
-
216
-
217
-
218
-
219
-
220
-
221
-
222
-
223
-
224
-
225
-
226
-
227
-
228
-
229
-
230
-
231
-
232
-
233
-
234
-
235
-
236
-
237
-
238
-
239
-
240
-
241
-
242
-
243
-
244
-
245
-
246
-
247
-
248
-
249
-
250
-
251
-
252
-
253
-
254
-
 255
255 -
 256
256 -
 257
257 -
 258
258 -
 259
259 -
 260
260 -
 261
261 -
 262
262 -
 263
263 -
 264
264 -
 265
265 -
 266
266 -
 267
267 -
 268
268 -
 269
269 -
 270
270 -
 271
271 -
 272
272 -
 273
273 -
 274
274 -
 275
275 -
276
-
277
-
278
-
279
-
280
-
281
-
282
-
283
-
284
-
285
-
286
-
287
-
288
-
289
-
290
-
291
-
292
-
293
-
294
-
295
-
296
-
297
-
298
-
299
-
300
-
301
-
302
-
303
-
304
-
305
-
306
-
307
-
308
-
309
-
310
-
311
-
312
-
313
-
314
-
315
-
316
-
317
-
318
-
319
-
320
-
321
-
322
-
323
-
324
-
325
-
326
-
327
-
328
-
329
-
330
-
331
-
332
-
333
-
334
-
335
-
336
-
337
-
338
-
339
-
340
-
341
-
342
 |
 |

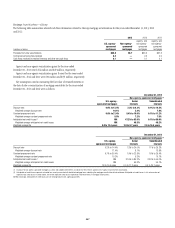
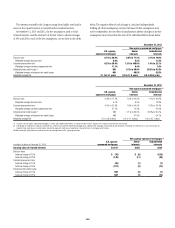
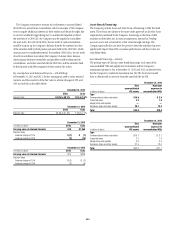
247
Mortgage Securitizations—Citicorp
The following table summarizes selected cash flow information related to Citicorp mortgage securitizations for the years ended December 31, 2013, 2012
and 2011:
2013 2012 2011
In billions of dollars
U.S. agency-
sponsored
mortgages
Non-agency-
sponsored
mortgages
Agency- and
non-agency-
sponsored
mortgages
Agency- and
non-agency-
sponsored
mortgages
Proceeds from new securitizations $65.8 $6.7 $56.5 $57.3
Contractual servicing fees received 0.4 — 0.5 0.5
Cash flows received on retained interests and other net cash flows 0.1 — 0.1 0.1
Agency and non-agency securitization gains for the year ended
December 31, 2013 were $154 million and $49 million, respectively.
Agency and non-agency securitization gains (losses) for the years ended
December 31, 2012 and 2011 were $30 million and $(9) million, respectively.
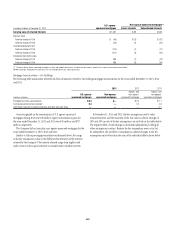
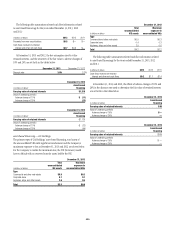
Key assumptions used in measuring the fair value of retained interests at
the date of sale or securitization of mortgage receivables for the years ended
December 31, 2013 and 2012 were as follows:
December 31, 2013
Non-agency-sponsored mortgages (1)
U.S. agency-
sponsored mortgages
Senior
interests
Subordinated
interests
Discount rate 0.0% to 12.4% 2.3% to 4.3% 0.1% to 19.2%
Weighted average discount rate 10.1% 3.4% 7.8%
Constant prepayment rate 0.0% to 21.4% 5.4% to 10.0% 0.1% to 11.2%
Weighted average constant prepayment rate 5.5% 7.2% 7.5%
Anticipated net credit losses (2) NM 47.2% to 53.0% 0.1% to 89.0%
Weighted average anticipated net credit losses NM 49.3% 49.2%
Weighted average life 0.0 to 12.4 years 2.9 to 9.7 years 2.5 to 16.5 years
December 31, 2012
Non-agency-sponsored mortgages (1)
U.S. agency-
sponsored mortgages
Senior
interests
Subordinated
interests
Discount rate 0.2% to 14.4% 1.2% to 24.0% 1.1% to 29.2%
Weighted average discount rate 11.4% 8.1% 13.8%
Constant prepayment rate 6.7% to 36.4% 1.9% to 22.8% 1.6% to 29.4%
Weighted average constant prepayment rate 10.2% 9.3% 10.1%
Anticipated net credit losses (2) NM 37.5% to 80.2% 33.4% to 90.0%
Weighted average anticipated net credit losses NM 60.3% 54.1%
Weighted average life 1.8 to 16.0 years 0.4 to 11.2 years 0.0 to 25.7 years
(1) Disclosure of non-agency-sponsored mortgages as senior and subordinated interests is indicative of the interests’ position in the capital structure of the securitization.
(2) Anticipated net credit losses represent estimated loss severity associated with defaulted mortgage loans underlying the mortgage securitizations disclosed above. Anticipated net credit losses, in this instance, do not
represent total credit losses incurred to date, nor do they represent credit losses expected on retained interests in mortgage securitizations.
NM Not meaningful. Anticipated net credit losses are not meaningful due to U.S. agency guarantees.