Citibank 2013 Annual Report Download - page 237
Download and view the complete annual report
Please find page 237 of the 2013 Citibank annual report below. You can navigate through the pages in the report by either clicking on the pages listed below, or by using the keyword search tool below to find specific information within the annual report.-
 1
1 -
2
-
3
-
4
-
5
-
6
-
7
-
8
-
9
-
10
-
11
-
12
-
13
-
14
-
15
-
16
-
17
-
18
-
19
-
20
-
21
-
22
-
23
-
24
-
25
-
26
-
27
-
28
-
29
-
30
-
31
-
32
-
33
-
34
-
35
-
36
-
37
-
38
-
39
-
40
-
41
-
42
-
43
-
44
-
45
-
46
-
47
-
48
-
49
-
50
-
51
-
52
-
53
-
54
-
55
-
56
-
57
-
58
-
59
-
60
-
61
-
62
-
63
-
64
-
65
-
66
-
67
-
68
-
69
-
70
-
71
-
72
-
73
-
74
-
75
-
76
-
77
-
78
-
79
-
80
-
81
-
82
-
83
-
84
-
85
-
86
-
87
-
88
-
89
-
90
-
91
-
92
-
93
-
94
-
95
-
96
-
97
-
98
-
99
-
100
-
101
-
102
-
103
-
104
-
105
-
106
-
107
-
108
-
109
-
110
-
111
-
112
-
113
-
114
-
115
-
116
-
117
-
118
-
119
-
120
-
121
-
122
-
123
-
124
-
125
-
126
-
127
-
128
-
129
-
130
-
131
-
132
-
133
-
134
-
135
-
136
-
137
-
138
-
139
-
140
-
141
-
142
-
143
-
144
-
145
-
146
-
147
-
148
-
149
-
150
-
151
-
152
-
153
-
154
-
155
-
156
-
157
-
158
-
159
-
160
-
161
-
162
-
163
-
164
-
165
-
166
-
167
-
168
-
169
-
170
-
171
-
172
-
173
-
174
-
175
-
176
-
177
-
178
-
179
-
180
-
181
-
182
-
183
-
184
-
185
-
186
-
187
-
188
-
189
-
190
-
191
-
192
-
193
-
194
-
195
-
196
-
197
-
198
-
199
-
200
-
201
-
202
-
203
-
204
-
205
-
206
-
207
-
208
-
209
-
210
-
211
-
212
-
213
-
214
-
215
-
216
-
217
-
218
-
219
-
220
-
221
-
222
-
223
-
224
-
225
-
226
-
 227
227 -
 228
228 -
 229
229 -
 230
230 -
 231
231 -
 232
232 -
 233
233 -
 234
234 -
 235
235 -
 236
236 -
 237
237 -
 238
238 -
 239
239 -
 240
240 -
 241
241 -
 242
242 -
 243
243 -
 244
244 -
 245
245 -
 246
246 -
 247
247 -
248
-
249
-
250
-
251
-
252
-
253
-
254
-
255
-
256
-
257
-
258
-
259
-
260
-
261
-
262
-
263
-
264
-
265
-
266
-
267
-
268
-
269
-
270
-
271
-
272
-
273
-
274
-
275
-
276
-
277
-
278
-
279
-
280
-
281
-
282
-
283
-
284
-
285
-
286
-
287
-
288
-
289
-
290
-
291
-
292
-
293
-
294
-
295
-
296
-
297
-
298
-
299
-
300
-
301
-
302
-
303
-
304
-
305
-
306
-
307
-
308
-
309
-
310
-
311
-
312
-
313
-
314
-
315
-
316
-
317
-
318
-
319
-
320
-
321
-
322
-
323
-
324
-
325
-
326
-
327
-
328
-
329
-
330
-
331
-
332
-
333
-
334
-
335
-
336
-
337
-
338
-
339
-
340
-
341
-
342
 |
 |

219
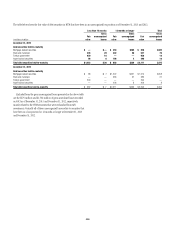
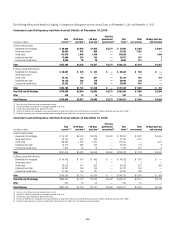
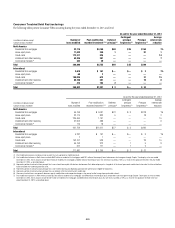
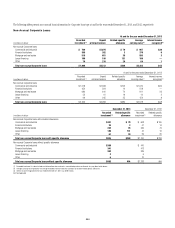
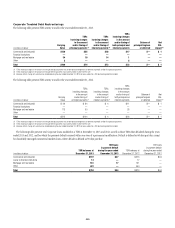
Consumer Troubled Debt Restructurings
The following tables present Consumer TDRs occurring during the years ended December 31, 2013 and 2012:
At and for the year ended December 31, 2013
In millions of dollars except
number of loans modified
Number of
loans modified
Post-modification
recorded investment (1)(2)
Deferred
principal (3)
Contingent
principal
forgiveness (4)
Principal
forgiveness (5)
Average
interest rate
reduction
North America
Residential first mortgages 32,116 $4,160 $68 $25 $158 1%
Home equity loans 11,043 349 1 — 91 1
Credit cards 172,211 826 — — — 14
Installment and other revolving 53,326 381 — — — 7
Commercial markets (6) 202 39 — — — —
Total 268,898 $5,755 $69 $25 $249
International
Residential first mortgages 3,618 $ 161 $— $— $ 2 1%
Home equity loans 68 2 — — — —
Credit cards 199,025 613 — — 21 15
Installment and other revolving 65,708 351 — — 10 8
Commercial markets (6) 413 104 2 — — —
Total 268,832 $1,231 $ 2 $— $ 33
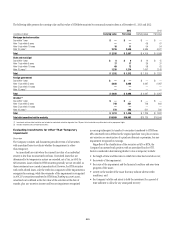
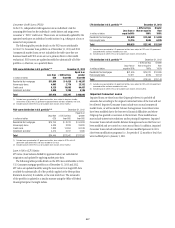
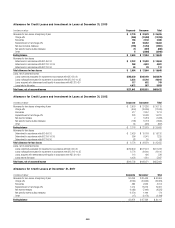
At and for the year ended December 31, 2012
In millions of dollars except
number of loans modified
Number of
loans modified
Post-modification
recorded investment (1)(7)
Deferred
principal (3)
Contingent
principal
forgiveness (4)
Principal
forgiveness (5)
Average
interest rate
reduction
North America
Residential first mortgages 66,759 $ 9,081 $22 $ 3 $218 1%
Home equity loans 32,710 833 5 — 78 2
Credit cards 234,460 1,191 — — — 15
Installment and other revolving 67,605 488 — — — 6
Commercial markets (6) 170 18 — — — —
Total 401,704 $11,611 $27 $ 3 $296
International
Residential first mortgages 5,237 $ 197 $— $— $ 3 1%
Home equity loans 7 1 — — — —
Credit cards 142,107 528 — — 23 15
Installment and other revolving 64,153 372 — 1 9 8
Commercial markets (6) 377 171 — 1 2 —
Total 211,881 $ 1,269 $— $ 2 $ 37
(1) Post-modification balances include past due amounts that are capitalized at modification date.
(2) Post-modification balances in North America include $502 million of residential first mortgages and $101 million of home equity loans to borrowers who have gone through Chapter 7 bankruptcy in the year ended
December 31, 2013. These amounts include $332 million of residential first mortgages and $85 million of home equity loans that are newly classified as TDRs as a result of OCC guidance received in the year ended
December 31, 2013, as described above.
(3) Represents portion of contractual loan principal that is non-interest bearing but still due from the borrower. Such deferred principal is charged off at the time of permanent modification to the extent that the related loan
balance exceeds the underlying collateral value.
(4) Represents portion of contractual loan principal that is non-interest bearing and, depending upon borrower performance, eligible for forgiveness.
(5) Represents portion of contractual loan principal that was forgiven at the time of permanent modification.
(6) Commercial markets loans are generally borrower-specific modifications and incorporate changes in the amount and/or timing of principal and/or interest.
(7) Post-modification balances in North America include $2,702 million of residential first mortgages and $498 million of home equity loans to borrowers who have gone through Chapter 7 bankruptcy in the year ended
December 31, 2012. These amounts include $1,401 million of residential first mortgages and $408 million of home equity loans that are newly classified as TDRs as a result of OCC guidance received in the year
ended December 31, 2012, as described above.