Citibank 2013 Annual Report Download - page 97
Download and view the complete annual report
Please find page 97 of the 2013 Citibank annual report below. You can navigate through the pages in the report by either clicking on the pages listed below, or by using the keyword search tool below to find specific information within the annual report.-
 1
1 -
2
-
3
-
4
-
5
-
6
-
7
-
8
-
9
-
10
-
11
-
12
-
13
-
14
-
15
-
16
-
17
-
18
-
19
-
20
-
21
-
22
-
23
-
24
-
25
-
26
-
27
-
28
-
29
-
30
-
31
-
32
-
33
-
34
-
35
-
36
-
37
-
38
-
39
-
40
-
41
-
42
-
43
-
44
-
45
-
46
-
47
-
48
-
49
-
50
-
51
-
52
-
53
-
54
-
55
-
56
-
57
-
58
-
59
-
60
-
61
-
62
-
63
-
64
-
65
-
66
-
67
-
68
-
69
-
70
-
71
-
72
-
73
-
74
-
75
-
76
-
77
-
78
-
79
-
80
-
81
-
82
-
83
-
84
-
85
-
86
-
 87
87 -
 88
88 -
 89
89 -
 90
90 -
 91
91 -
 92
92 -
 93
93 -
 94
94 -
 95
95 -
 96
96 -
 97
97 -
 98
98 -
 99
99 -
 100
100 -
 101
101 -
 102
102 -
 103
103 -
 104
104 -
 105
105 -
 106
106 -
 107
107 -
108
-
109
-
110
-
111
-
112
-
113
-
114
-
115
-
116
-
117
-
118
-
119
-
120
-
121
-
122
-
123
-
124
-
125
-
126
-
127
-
128
-
129
-
130
-
131
-
132
-
133
-
134
-
135
-
136
-
137
-
138
-
139
-
140
-
141
-
142
-
143
-
144
-
145
-
146
-
147
-
148
-
149
-
150
-
151
-
152
-
153
-
154
-
155
-
156
-
157
-
158
-
159
-
160
-
161
-
162
-
163
-
164
-
165
-
166
-
167
-
168
-
169
-
170
-
171
-
172
-
173
-
174
-
175
-
176
-
177
-
178
-
179
-
180
-
181
-
182
-
183
-
184
-
185
-
186
-
187
-
188
-
189
-
190
-
191
-
192
-
193
-
194
-
195
-
196
-
197
-
198
-
199
-
200
-
201
-
202
-
203
-
204
-
205
-
206
-
207
-
208
-
209
-
210
-
211
-
212
-
213
-
214
-
215
-
216
-
217
-
218
-
219
-
220
-
221
-
222
-
223
-
224
-
225
-
226
-
227
-
228
-
229
-
230
-
231
-
232
-
233
-
234
-
235
-
236
-
237
-
238
-
239
-
240
-
241
-
242
-
243
-
244
-
245
-
246
-
247
-
248
-
249
-
250
-
251
-
252
-
253
-
254
-
255
-
256
-
257
-
258
-
259
-
260
-
261
-
262
-
263
-
264
-
265
-
266
-
267
-
268
-
269
-
270
-
271
-
272
-
273
-
274
-
275
-
276
-
277
-
278
-
279
-
280
-
281
-
282
-
283
-
284
-
285
-
286
-
287
-
288
-
289
-
290
-
291
-
292
-
293
-
294
-
295
-
296
-
297
-
298
-
299
-
300
-
301
-
302
-
303
-
304
-
305
-
306
-
307
-
308
-
309
-
310
-
311
-
312
-
313
-
314
-
315
-
316
-
317
-
318
-
319
-
320
-
321
-
322
-
323
-
324
-
325
-
326
-
327
-
328
-
329
-
330
-
331
-
332
-
333
-
334
-
335
-
336
-
337
-
338
-
339
-
340
-
341
-
342
 |
 |

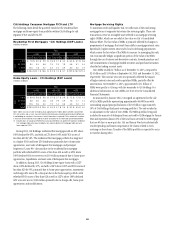
79
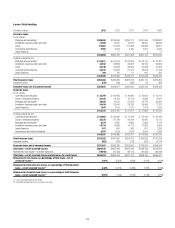
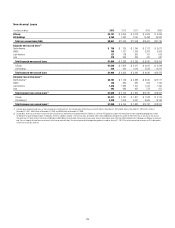
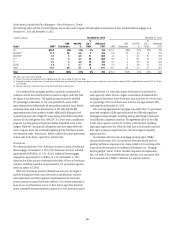
Non-Accrual Loans
In millions of dollars 2013 2012 2011 2010 2009
Citicorp $3,791 $ 4,096 $ 4,018 $ 4,909 $ 5,353
Citi Holdings 5,166 7,433 7,050 14,498 26,387
Total non-accrual loans (NAL) $8,957 $11,529 $11,068 $19,407 $31,740
Corporate non-accrual loans (1)
North America $ 736 $ 735 $ 1,246 $ 2,112 $ 5,621
EMEA 766 1,131 1,293 5,337 6,308
Latin America 127 128 362 701 569
Asia 279 339 335 470 981
Total Corporate non-accrual loans $1,908 $ 2,333 $ 3,236 $ 8,620 $13,479
Citicorp $1,580 $ 1,909 $ 2,217 $ 3,091 $ 3,238
Citi Holdings 328 424 1,019 5,529 10,241
Total Corporate non-accrual loans $1,908 $ 2,333 $ 3,236 $ 8,620 $13,479
Consumer non-accrual loans (1)
North America (2) $5,192 $ 7,148 $ 5,888 $ 8,540 $15,111
EMEA 138 380 387 652 1,159
Latin America 1,426 1,285 1,107 1,019 1,340
Asia 293 383 450 576 651
Total Consumer non-accrual loans (2) $7,049 $ 9,196 $ 7,832 $10,787 $18,261
Citicorp $2,211 $ 2,187 $ 1,801 $ 1,818 $ 2,115
Citi Holdings (2) 4,838 7,009 6,031 8,969 16,146
Total Consumer non-accrual loans (2) $7,049 $ 9,196 $ 7,832 $10,787 $18,261
(1) Excludes purchased distressed loans, as they are generally accreting interest. The carrying value of these loans was $749 million at December 31, 2013, $538 million at December 31, 2012, $511 million at
December 31, 2011, $469 million at December 31, 2010, and $920 million at December 31, 2009.
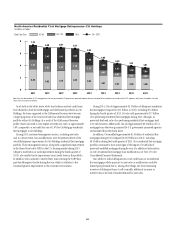
(2) During 2012, there was an increase in Consumer non-accrual loans in North America of approximately $1.5 billion as a result of OCC guidance issued in the third quarter of 2012 regarding mortgage loans where
the borrower has gone through Chapter 7 bankruptcy. Of the $1.5 billion in Chapter 7 non-accrual loans, $1.3 billion were current. Additionally, during the first quarter of 2012 there was an increase in non-accrual
Consumer loans in North America, which was attributable to a $0.8 billion reclassification from accrual to non-accrual status of home equity loans where the related residential first mortgage was 90 days or more past
due. The vast majority of these loans were current at the time of reclassification. The reclassification reflected regulatory guidance issued on January 31, 2012. The reclassification had no impact on Citi’s delinquency
statistics or its loan loss reserves.