Citibank 2013 Annual Report Download - page 61
Download and view the complete annual report
Please find page 61 of the 2013 Citibank annual report below. You can navigate through the pages in the report by either clicking on the pages listed below, or by using the keyword search tool below to find specific information within the annual report.-
 1
1 -
2
-
3
-
4
-
5
-
6
-
7
-
8
-
9
-
10
-
11
-
12
-
13
-
14
-
15
-
16
-
17
-
18
-
19
-
20
-
21
-
22
-
23
-
24
-
25
-
26
-
27
-
28
-
29
-
30
-
31
-
32
-
33
-
34
-
35
-
36
-
37
-
38
-
39
-
40
-
41
-
42
-
43
-
44
-
45
-
46
-
47
-
48
-
49
-
50
-
 51
51 -
 52
52 -
 53
53 -
 54
54 -
 55
55 -
 56
56 -
 57
57 -
 58
58 -
 59
59 -
 60
60 -
 61
61 -
 62
62 -
 63
63 -
 64
64 -
 65
65 -
 66
66 -
 67
67 -
 68
68 -
 69
69 -
 70
70 -
 71
71 -
72
-
73
-
74
-
75
-
76
-
77
-
78
-
79
-
80
-
81
-
82
-
83
-
84
-
85
-
86
-
87
-
88
-
89
-
90
-
91
-
92
-
93
-
94
-
95
-
96
-
97
-
98
-
99
-
100
-
101
-
102
-
103
-
104
-
105
-
106
-
107
-
108
-
109
-
110
-
111
-
112
-
113
-
114
-
115
-
116
-
117
-
118
-
119
-
120
-
121
-
122
-
123
-
124
-
125
-
126
-
127
-
128
-
129
-
130
-
131
-
132
-
133
-
134
-
135
-
136
-
137
-
138
-
139
-
140
-
141
-
142
-
143
-
144
-
145
-
146
-
147
-
148
-
149
-
150
-
151
-
152
-
153
-
154
-
155
-
156
-
157
-
158
-
159
-
160
-
161
-
162
-
163
-
164
-
165
-
166
-
167
-
168
-
169
-
170
-
171
-
172
-
173
-
174
-
175
-
176
-
177
-
178
-
179
-
180
-
181
-
182
-
183
-
184
-
185
-
186
-
187
-
188
-
189
-
190
-
191
-
192
-
193
-
194
-
195
-
196
-
197
-
198
-
199
-
200
-
201
-
202
-
203
-
204
-
205
-
206
-
207
-
208
-
209
-
210
-
211
-
212
-
213
-
214
-
215
-
216
-
217
-
218
-
219
-
220
-
221
-
222
-
223
-
224
-
225
-
226
-
227
-
228
-
229
-
230
-
231
-
232
-
233
-
234
-
235
-
236
-
237
-
238
-
239
-
240
-
241
-
242
-
243
-
244
-
245
-
246
-
247
-
248
-
249
-
250
-
251
-
252
-
253
-
254
-
255
-
256
-
257
-
258
-
259
-
260
-
261
-
262
-
263
-
264
-
265
-
266
-
267
-
268
-
269
-
270
-
271
-
272
-
273
-
274
-
275
-
276
-
277
-
278
-
279
-
280
-
281
-
282
-
283
-
284
-
285
-
286
-
287
-
288
-
289
-
290
-
291
-
292
-
293
-
294
-
295
-
296
-
297
-
298
-
299
-
300
-
301
-
302
-
303
-
304
-
305
-
306
-
307
-
308
-
309
-
310
-
311
-
312
-
313
-
314
-
315
-
316
-
317
-
318
-
319
-
320
-
321
-
322
-
323
-
324
-
325
-
326
-
327
-
328
-
329
-
330
-
331
-
332
-
333
-
334
-
335
-
336
-
337
-
338
-
339
-
340
-
341
-
342
 |
 |

43
Citigroup’s risk-weighted assets are principally derived from application
of the risk-based capital guidelines related to the measurement of credit
risk. Pursuant to these guidelines, on balance sheet assets and the credit
equivalent amount of certain off-balance-sheet exposures (such as financial
guarantees, unfunded lending commitments, letters of credit and derivatives)
are assigned to one of several prescribed risk-weight categories based upon
the perceived credit risk associated with the obligor or, if relevant, the
guarantor, the nature of the collateral, or external credit ratings. Risk-
weighted assets also incorporate a measure for market risk on covered
trading account positions and foreign exchange and commodity positions
whether or not carried in the trading account. Excluded from risk-weighted
assets are any assets, such as goodwill and deferred tax assets, to the extent
required to be deducted from regulatory capital.
Citigroup is also subject to a Leverage ratio requirement, a non-risk-
based measure of capital adequacy, which is defined as Tier 1 Capital as a
percentage of quarterly adjusted average total assets.
To be “well capitalized” under current federal bank regulatory agency
definitions, a bank holding company must have a Tier 1 Capital ratio of at
least 6%, a Total Capital ratio of at least 10%, and not be subject to a Federal
Reserve Board directive to maintain higher capital levels. In addition,
the Federal Reserve Board currently expects bank holding companies to
maintain a minimum Leverage ratio of 3% or 4%, depending on factors
specified in its regulations.
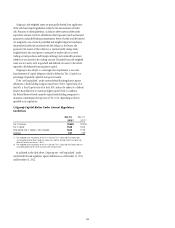
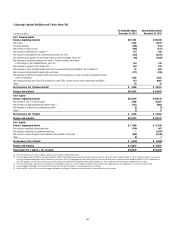
Citigroup Capital Ratios Under Current Regulatory
Guidelines
Dec. 31,
2013 (1)
Dec. 31,
2012 (2)
Tier 1 Common 12.64% 12.67%
Tier 1 Capital 13.68 14.06
Total Capital (Tier 1 Capital + Tier 2 Capital) 16.65 17.26
Leverage 8.21 7.48
(1) Risk-weighted assets for purposes of the Tier 1 Common, Tier 1 Capital and Total Capital ratios
are calculated based on Basel I credit risk capital rules and final (revised) market risk capital rules
(Basel II.5) effective on January 1, 2013.
(2) Risk-weighted assets for purposes of the Tier 1 Common, Tier 1 Capital and Total Capital ratios are
calculated based on Basel I credit risk and market risk capital rules.
As indicated in the table above, Citigroup was “well capitalized” under
current federal bank regulatory agency definitions as of December 31, 2013
and December 31, 2012.