Citibank 2013 Annual Report Download - page 93
Download and view the complete annual report
Please find page 93 of the 2013 Citibank annual report below. You can navigate through the pages in the report by either clicking on the pages listed below, or by using the keyword search tool below to find specific information within the annual report.-
 1
1 -
2
-
3
-
4
-
5
-
6
-
7
-
8
-
9
-
10
-
11
-
12
-
13
-
14
-
15
-
16
-
17
-
18
-
19
-
20
-
21
-
22
-
23
-
24
-
25
-
26
-
27
-
28
-
29
-
30
-
31
-
32
-
33
-
34
-
35
-
36
-
37
-
38
-
39
-
40
-
41
-
42
-
43
-
44
-
45
-
46
-
47
-
48
-
49
-
50
-
51
-
52
-
53
-
54
-
55
-
56
-
57
-
58
-
59
-
60
-
61
-
62
-
63
-
64
-
65
-
66
-
67
-
68
-
69
-
70
-
71
-
72
-
73
-
74
-
75
-
76
-
77
-
78
-
79
-
80
-
81
-
82
-
 83
83 -
 84
84 -
 85
85 -
 86
86 -
 87
87 -
 88
88 -
 89
89 -
 90
90 -
 91
91 -
 92
92 -
 93
93 -
 94
94 -
 95
95 -
 96
96 -
 97
97 -
 98
98 -
 99
99 -
 100
100 -
 101
101 -
 102
102 -
 103
103 -
104
-
105
-
106
-
107
-
108
-
109
-
110
-
111
-
112
-
113
-
114
-
115
-
116
-
117
-
118
-
119
-
120
-
121
-
122
-
123
-
124
-
125
-
126
-
127
-
128
-
129
-
130
-
131
-
132
-
133
-
134
-
135
-
136
-
137
-
138
-
139
-
140
-
141
-
142
-
143
-
144
-
145
-
146
-
147
-
148
-
149
-
150
-
151
-
152
-
153
-
154
-
155
-
156
-
157
-
158
-
159
-
160
-
161
-
162
-
163
-
164
-
165
-
166
-
167
-
168
-
169
-
170
-
171
-
172
-
173
-
174
-
175
-
176
-
177
-
178
-
179
-
180
-
181
-
182
-
183
-
184
-
185
-
186
-
187
-
188
-
189
-
190
-
191
-
192
-
193
-
194
-
195
-
196
-
197
-
198
-
199
-
200
-
201
-
202
-
203
-
204
-
205
-
206
-
207
-
208
-
209
-
210
-
211
-
212
-
213
-
214
-
215
-
216
-
217
-
218
-
219
-
220
-
221
-
222
-
223
-
224
-
225
-
226
-
227
-
228
-
229
-
230
-
231
-
232
-
233
-
234
-
235
-
236
-
237
-
238
-
239
-
240
-
241
-
242
-
243
-
244
-
245
-
246
-
247
-
248
-
249
-
250
-
251
-
252
-
253
-
254
-
255
-
256
-
257
-
258
-
259
-
260
-
261
-
262
-
263
-
264
-
265
-
266
-
267
-
268
-
269
-
270
-
271
-
272
-
273
-
274
-
275
-
276
-
277
-
278
-
279
-
280
-
281
-
282
-
283
-
284
-
285
-
286
-
287
-
288
-
289
-
290
-
291
-
292
-
293
-
294
-
295
-
296
-
297
-
298
-
299
-
300
-
301
-
302
-
303
-
304
-
305
-
306
-
307
-
308
-
309
-
310
-
311
-
312
-
313
-
314
-
315
-
316
-
317
-
318
-
319
-
320
-
321
-
322
-
323
-
324
-
325
-
326
-
327
-
328
-
329
-
330
-
331
-
332
-
333
-
334
-
335
-
336
-
337
-
338
-
339
-
340
-
341
-
342
 |
 |

75
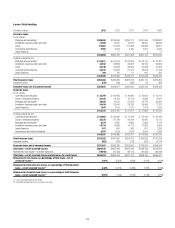
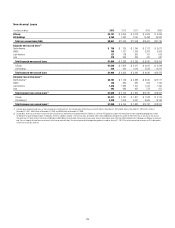
Loans Outstanding
In millions of dollars 2013 2012 2011 2010 2009
Consumer loans
In U.S. offices
Mortgage and real estate (1) $108,453 $125,946 $139,177 $151,469 $183,842
Installment, revolving credit, and other 13,398 14,070 15,616 28,291 58,099
Cards 115,651 111,403 117,908 122,384 28,951
Commercial and industrial 6,592 5,344 4,766 5,021 5,640
Lease financing —— 1 2 11
$244,094 $256,763 $277,468 $307,167 $276,543
In offices outside the U.S.
Mortgage and real estate (1) $ 55,511 $ 54,709 $ 52,052 $ 52,175 $ 47,297
Installment, revolving credit, and other 33,182 33,958 32,673 36,132 39,859
Cards 36,740 40,653 38,926 40,948 41,493
Commercial and industrial 24,107 22,225 21,915 18,028 17,129
Lease financing 769 781 711 665 331
$150,309 $152,326 $146,277 $147,948 $146,109
Total Consumer loans $394,403 $409,089 $423,745 $455,115 $422,652
Unearned income (572) (418) (405) 69 808
Consumer loans, net of unearned income $393,831 $408,671 $423,340 $455,184 $423,460
Corporate loans
In U.S. offices
Commercial and industrial $ 32,704 $ 26,985 $ 20,830 $ 13,669 $ 15,614
Loans to financial institutions 25,102 18,159 15,113 8,995 6,947
Mortgage and real estate (1) 29,425 24,705 21,516 19,770 22,560
Installment, revolving credit, and other 34,434 32,446 33,182 34,046 17,737
Lease financing 1,647 1,410 1,270 1,413 1,297
$123,312 $103,705 $ 91,911 $ 77,893 $ 64,155
In offices outside the U.S.
Commercial and industrial $ 82,663 $ 82,939 $ 79,764 $ 72,166 $ 67,344
Loans to financial institutions 38,372 37,739 29,794 22,620 15,113
Mortgage and real estate (1) 6,274 6,485 6,885 5,899 9,779
Installment, revolving credit, and other 18,714 14,958 14,114 11,829 9,683
Lease financing 527 605 568 531 1,295
Governments and official institutions 2,341 1,159 1,576 3,644 2,949
$148,891 $143,885 $132,701 $116,689 $106,163
Total Corporate loans $272,203 $247,590 $224,612 $194,582 $170,318
Unearned income (562) (797) (710) (972) (2,274)
Corporate loans, net of unearned income $271,641 $246,793 $223,902 $193,610 $168,044
Total loans—net of unearned income $665,472 $655,464 $647,242 $648,794 $591,504
Allowance for loan losses—on drawn exposures (19,648) (25,455) (30,115) (40,655) (36,033)
Total loans—net of unearned income and allowance for credit losses $645,824 $630,009 $617,127 $608,139 $555,471
Allowance for loan losses as a percentage of total loans—net of
unearned income (2) 2.97% 3.92% 4.69% 6.31% 6.09%
Allowance for Consumer loan losses as a percentage of total Consumer
loans—net of unearned income (2) 4.34% 5.57% 6.45% 7.81% 6.69%
Allowance for Corporate loan losses as a percentage of total Corporate
loans—net of unearned income (2) 0.97% 1.14% 1.31% 2.75% 4.57%
(1) Loans secured primarily by real estate.
(2) All periods exclude loans that are carried at fair value.