Citibank 2013 Annual Report Download - page 303
Download and view the complete annual report
Please find page 303 of the 2013 Citibank annual report below. You can navigate through the pages in the report by either clicking on the pages listed below, or by using the keyword search tool below to find specific information within the annual report.-
 1
1 -
2
-
3
-
4
-
5
-
6
-
7
-
8
-
9
-
10
-
11
-
12
-
13
-
14
-
15
-
16
-
17
-
18
-
19
-
20
-
21
-
22
-
23
-
24
-
25
-
26
-
27
-
28
-
29
-
30
-
31
-
32
-
33
-
34
-
35
-
36
-
37
-
38
-
39
-
40
-
41
-
42
-
43
-
44
-
45
-
46
-
47
-
48
-
49
-
50
-
51
-
52
-
53
-
54
-
55
-
56
-
57
-
58
-
59
-
60
-
61
-
62
-
63
-
64
-
65
-
66
-
67
-
68
-
69
-
70
-
71
-
72
-
73
-
74
-
75
-
76
-
77
-
78
-
79
-
80
-
81
-
82
-
83
-
84
-
85
-
86
-
87
-
88
-
89
-
90
-
91
-
92
-
93
-
94
-
95
-
96
-
97
-
98
-
99
-
100
-
101
-
102
-
103
-
104
-
105
-
106
-
107
-
108
-
109
-
110
-
111
-
112
-
113
-
114
-
115
-
116
-
117
-
118
-
119
-
120
-
121
-
122
-
123
-
124
-
125
-
126
-
127
-
128
-
129
-
130
-
131
-
132
-
133
-
134
-
135
-
136
-
137
-
138
-
139
-
140
-
141
-
142
-
143
-
144
-
145
-
146
-
147
-
148
-
149
-
150
-
151
-
152
-
153
-
154
-
155
-
156
-
157
-
158
-
159
-
160
-
161
-
162
-
163
-
164
-
165
-
166
-
167
-
168
-
169
-
170
-
171
-
172
-
173
-
174
-
175
-
176
-
177
-
178
-
179
-
180
-
181
-
182
-
183
-
184
-
185
-
186
-
187
-
188
-
189
-
190
-
191
-
192
-
193
-
194
-
195
-
196
-
197
-
198
-
199
-
200
-
201
-
202
-
203
-
204
-
205
-
206
-
207
-
208
-
209
-
210
-
211
-
212
-
213
-
214
-
215
-
216
-
217
-
218
-
219
-
220
-
221
-
222
-
223
-
224
-
225
-
226
-
227
-
228
-
229
-
230
-
231
-
232
-
233
-
234
-
235
-
236
-
237
-
238
-
239
-
240
-
241
-
242
-
243
-
244
-
245
-
246
-
247
-
248
-
249
-
250
-
251
-
252
-
253
-
254
-
255
-
256
-
257
-
258
-
259
-
260
-
261
-
262
-
263
-
264
-
265
-
266
-
267
-
268
-
269
-
270
-
271
-
272
-
273
-
274
-
275
-
276
-
277
-
278
-
279
-
280
-
281
-
282
-
283
-
284
-
285
-
286
-
287
-
288
-
289
-
290
-
291
-
292
-
 293
293 -
 294
294 -
 295
295 -
 296
296 -
 297
297 -
 298
298 -
 299
299 -
 300
300 -
 301
301 -
 302
302 -
 303
303 -
 304
304 -
 305
305 -
 306
306 -
 307
307 -
 308
308 -
 309
309 -
 310
310 -
 311
311 -
 312
312 -
 313
313 -
314
-
315
-
316
-
317
-
318
-
319
-
320
-
321
-
322
-
323
-
324
-
325
-
326
-
327
-
328
-
329
-
330
-
331
-
332
-
333
-
334
-
335
-
336
-
337
-
338
-
339
-
340
-
341
-
342
 |
 |

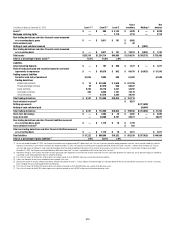
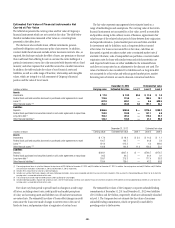
285
As of December 31, 2012
Fair Value
(in millions)
(1)
Methodology Input Low (2)(3) High (2)(3)
Assets
Federal funds sold and securities
borrowed or purchased under
agreements to resell $ 4,786 Cash flow Interest rate 1.09% 1.50%
Trading and investment securities
Mortgage-backed securities $ 4,402 Price-based Price $ — $ 135.00
1,148 Yield analysis Yield —% 25.84%
Prepayment period 2.16 years 7.84 years
State and municipal, foreign government,
corporate and other debt securities $ 4,416 Price-based Price $ 0.00 $ 159.63
1,231 Cash flow Yield 0.00% 30.00%
787 Yield analysis Credit spread 35 bps 300 bps
Equity securities $ 792 Cash flow Yield 9.00% 10.00%
147 Price-based Prepayment period 3 years 3 years
Price $ 0.00 $ 750.00
Asset-backed securities $ 4,253 Price-based Price $ — $ 137
1,775 Internal model Yield —% 27.00%
561 Cash flow Credit correlation 15.00% 90.00%
Weighted average life (WAL) 0.34 years 16.07 years
Non-marketable equity $ 2,768 Price-based Fund NAV $ 1.00 $456,773,838
1,803 Comparables analysis EBITDA multiples 4.70x 14.39x
Price-to-book ratio 0.77x 1.50x
709 Cash flow Discount to price —% 75.00%
Derivatives—Gross (4)
Interest rate contracts (gross) $3,202 Internal model Interest rate (IR)-IR correlation (98.00)% 90.00%
Credit spread 0 bps 550.27 bps
IR volatility 0.09% 100.00%
Interest rate —% 15.00%
Foreign exchange contracts (gross) $ 1,542 Internal model Foreign exchange (FX) volatility 3.20% 67.35%
IR-FX correlation 40.00% 60.00%
Credit spread 0 bps 376 bps
Equity contracts (gross) (5) $ 4,669 Internal model Equity volatility 1.00% 185.20%
Equity forward 74.94% 132.70%
Equity-equity correlation 1.00% 99.90%
Commodity contracts (gross) $2,160 Internal model Forward price 37.45% 181.50%
Commodity correlation (77.00)% 95.00%
Commodity volatility 5.00% 148.00%
Credit derivatives (gross) $4,777 Internal model Price $ 0.00 $ 121.16
3,886 Price-based Recovery rate 6.50% 78.00%
Credit correlation 5.00% 99.00%
Credit spread 0 bps 2,236 bps
Upfront points 3.62 100.00