Citibank 2013 Annual Report Download - page 185
Download and view the complete annual report
Please find page 185 of the 2013 Citibank annual report below. You can navigate through the pages in the report by either clicking on the pages listed below, or by using the keyword search tool below to find specific information within the annual report.-
 1
1 -
2
-
3
-
4
-
5
-
6
-
7
-
8
-
9
-
10
-
11
-
12
-
13
-
14
-
15
-
16
-
17
-
18
-
19
-
20
-
21
-
22
-
23
-
24
-
25
-
26
-
27
-
28
-
29
-
30
-
31
-
32
-
33
-
34
-
35
-
36
-
37
-
38
-
39
-
40
-
41
-
42
-
43
-
44
-
45
-
46
-
47
-
48
-
49
-
50
-
51
-
52
-
53
-
54
-
55
-
56
-
57
-
58
-
59
-
60
-
61
-
62
-
63
-
64
-
65
-
66
-
67
-
68
-
69
-
70
-
71
-
72
-
73
-
74
-
75
-
76
-
77
-
78
-
79
-
80
-
81
-
82
-
83
-
84
-
85
-
86
-
87
-
88
-
89
-
90
-
91
-
92
-
93
-
94
-
95
-
96
-
97
-
98
-
99
-
100
-
101
-
102
-
103
-
104
-
105
-
106
-
107
-
108
-
109
-
110
-
111
-
112
-
113
-
114
-
115
-
116
-
117
-
118
-
119
-
120
-
121
-
122
-
123
-
124
-
125
-
126
-
127
-
128
-
129
-
130
-
131
-
132
-
133
-
134
-
135
-
136
-
137
-
138
-
139
-
140
-
141
-
142
-
143
-
144
-
145
-
146
-
147
-
148
-
149
-
150
-
151
-
152
-
153
-
154
-
155
-
156
-
157
-
158
-
159
-
160
-
161
-
162
-
163
-
164
-
165
-
166
-
167
-
168
-
169
-
170
-
171
-
172
-
173
-
174
-
 175
175 -
 176
176 -
 177
177 -
 178
178 -
 179
179 -
 180
180 -
 181
181 -
 182
182 -
 183
183 -
 184
184 -
 185
185 -
 186
186 -
 187
187 -
 188
188 -
 189
189 -
 190
190 -
 191
191 -
 192
192 -
 193
193 -
 194
194 -
 195
195 -
196
-
197
-
198
-
199
-
200
-
201
-
202
-
203
-
204
-
205
-
206
-
207
-
208
-
209
-
210
-
211
-
212
-
213
-
214
-
215
-
216
-
217
-
218
-
219
-
220
-
221
-
222
-
223
-
224
-
225
-
226
-
227
-
228
-
229
-
230
-
231
-
232
-
233
-
234
-
235
-
236
-
237
-
238
-
239
-
240
-
241
-
242
-
243
-
244
-
245
-
246
-
247
-
248
-
249
-
250
-
251
-
252
-
253
-
254
-
255
-
256
-
257
-
258
-
259
-
260
-
261
-
262
-
263
-
264
-
265
-
266
-
267
-
268
-
269
-
270
-
271
-
272
-
273
-
274
-
275
-
276
-
277
-
278
-
279
-
280
-
281
-
282
-
283
-
284
-
285
-
286
-
287
-
288
-
289
-
290
-
291
-
292
-
293
-
294
-
295
-
296
-
297
-
298
-
299
-
300
-
301
-
302
-
303
-
304
-
305
-
306
-
307
-
308
-
309
-
310
-
311
-
312
-
313
-
314
-
315
-
316
-
317
-
318
-
319
-
320
-
321
-
322
-
323
-
324
-
325
-
326
-
327
-
328
-
329
-
330
-
331
-
332
-
333
-
334
-
335
-
336
-
337
-
338
-
339
-
340
-
341
-
342
 |
 |
167
OCC Chapter 7 Bankruptcy Guidance
In the third quarter of 2012, the Office of the Comptroller of the Currency
(OCC) issued guidance relating to the accounting for mortgage loans
discharged through bankruptcy proceedings pursuant to Chapter 7 of the
U.S. Bankruptcy Code (Chapter 7 bankruptcy). Under this OCC guidance,
the discharged loans are accounted for as troubled debt restructurings
(TDRs). These TDRs, other than FHA-insured loans, are written down to their
collateral value less cost to sell. FHA-insured loans are reserved for, based on
a discounted cash flow model. As a result of implementing this guidance,
Citigroup recorded an incremental $635 million of charge-offs in the third
quarter of 2012, the vast majority of which related to loans that were current.
These charge-offs were substantially offset by a related loan loss reserve
release of approximately $600 million, with a net reduction in pretax income
of $35 million. In the fourth quarter of 2012, Citigroup recorded a benefit
to charge-offs of approximately $40 million related to finalizing the impact
of this OCC guidance. Furthermore, as a result of this OCC guidance, TDRs
increased by $1.7 billion and non-accrual loans increased by $1.5 billion in
the third quarter of 2012 ($1.3 billion of which was current).
Presentation of Comprehensive Income
In June 2011, the FASB issued ASU No. 2011-05, Comprehensive Income
(Topic 220): Presentation of Comprehensive Income. The ASU requires
an entity to present the total of comprehensive income, the components of
net income, and the components of Other Comprehensive Income (OCI)
either in a single continuous statement of comprehensive income or in two
separate but consecutive statements. Citigroup selected the two-statement
approach. Under this approach, Citi is required to present components of net
income and total net income in the Statement of Income. The Statement of
Comprehensive Income follows the Statement of Income and includes the
components of OCI and a total for OCI, along with a total for comprehensive
income. The ASU removed the option of reporting OCI in the statement of
changes in stockholders’ equity. This ASU became effective for Citigroup on
January 1, 2012 and a Statement of Comprehensive Income is included in
these Consolidated Financial Statements.
Fair Value Measurement
In May 2011, the FASB issued ASU No. 2011-04, Fair Value Measurement
(Topic 820): Amendments to Achieve Common Fair Value Measurement
and Disclosure Requirements in U.S. GAAP and IFRS. The ASU created
a common definition of fair value for GAAP and IFRS and aligned the
measurement and disclosure requirements. It required significant additional
disclosures both of a qualitative and quantitative nature, particularly for
those instruments measured at fair value that are classified in Level 3 of
the fair value hierarchy. Additionally, the ASU provided guidance on when
it is appropriate to measure fair value on a portfolio basis and expanded
the prohibition on valuation adjustments where the size of the Company’s
position is a characteristic of the adjustment from Level 1 to all levels of the
fair value hierarchy.
The ASU became effective for Citigroup on January 1, 2012. As a result of
implementing the prohibition on valuation adjustments where the size of
the Company’s position is a characteristic, the Company released reserves of
approximately $125 million, increasing pretax income in the first quarter
of 2012.
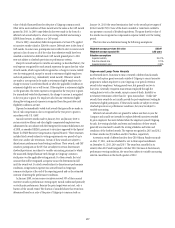
Deferred Asset Acquisition Costs
In October 2010, the FASB issued ASU No. 2010-26, Financial Services—
Insurance (Topic 944): Accounting for Costs Associated with Acquiring
or Renewing Insurance Contracts. The ASU amended the guidance for
insurance entities that required deferral and subsequent amortization of
certain costs incurred during the acquisition of new or renewed insurance
contracts, commonly referred to as deferred acquisition costs (DAC). The
new guidance limited DAC to those costs directly related to the successful
acquisition of insurance contracts; all other acquisition-related costs must be
expensed as incurred. Under prior guidance, DAC consisted of those costs that
vary with, and primarily relate to, the acquisition of insurance contracts.
The ASU became effective for Citigroup on January 1, 2012 and was
adopted using the retrospective method. As a result of implementing the ASU,
in the first quarter of 2012, DAC was reduced by approximately $165 million
and a $58 million deferred tax asset was recorded with an offset to opening
retained earnings of $107 million (net of tax).