Citibank 2013 Annual Report Download - page 143
Download and view the complete annual report
Please find page 143 of the 2013 Citibank annual report below. You can navigate through the pages in the report by either clicking on the pages listed below, or by using the keyword search tool below to find specific information within the annual report.-
 1
1 -
2
-
3
-
4
-
5
-
6
-
7
-
8
-
9
-
10
-
11
-
12
-
13
-
14
-
15
-
16
-
17
-
18
-
19
-
20
-
21
-
22
-
23
-
24
-
25
-
26
-
27
-
28
-
29
-
30
-
31
-
32
-
33
-
34
-
35
-
36
-
37
-
38
-
39
-
40
-
41
-
42
-
43
-
44
-
45
-
46
-
47
-
48
-
49
-
50
-
51
-
52
-
53
-
54
-
55
-
56
-
57
-
58
-
59
-
60
-
61
-
62
-
63
-
64
-
65
-
66
-
67
-
68
-
69
-
70
-
71
-
72
-
73
-
74
-
75
-
76
-
77
-
78
-
79
-
80
-
81
-
82
-
83
-
84
-
85
-
86
-
87
-
88
-
89
-
90
-
91
-
92
-
93
-
94
-
95
-
96
-
97
-
98
-
99
-
100
-
101
-
102
-
103
-
104
-
105
-
106
-
107
-
108
-
109
-
110
-
111
-
112
-
113
-
114
-
115
-
116
-
117
-
118
-
119
-
120
-
121
-
122
-
123
-
124
-
125
-
126
-
127
-
128
-
129
-
130
-
131
-
132
-
 133
133 -
 134
134 -
 135
135 -
 136
136 -
 137
137 -
 138
138 -
 139
139 -
 140
140 -
 141
141 -
 142
142 -
 143
143 -
 144
144 -
 145
145 -
 146
146 -
 147
147 -
 148
148 -
 149
149 -
 150
150 -
 151
151 -
 152
152 -
 153
153 -
154
-
155
-
156
-
157
-
158
-
159
-
160
-
161
-
162
-
163
-
164
-
165
-
166
-
167
-
168
-
169
-
170
-
171
-
172
-
173
-
174
-
175
-
176
-
177
-
178
-
179
-
180
-
181
-
182
-
183
-
184
-
185
-
186
-
187
-
188
-
189
-
190
-
191
-
192
-
193
-
194
-
195
-
196
-
197
-
198
-
199
-
200
-
201
-
202
-
203
-
204
-
205
-
206
-
207
-
208
-
209
-
210
-
211
-
212
-
213
-
214
-
215
-
216
-
217
-
218
-
219
-
220
-
221
-
222
-
223
-
224
-
225
-
226
-
227
-
228
-
229
-
230
-
231
-
232
-
233
-
234
-
235
-
236
-
237
-
238
-
239
-
240
-
241
-
242
-
243
-
244
-
245
-
246
-
247
-
248
-
249
-
250
-
251
-
252
-
253
-
254
-
255
-
256
-
257
-
258
-
259
-
260
-
261
-
262
-
263
-
264
-
265
-
266
-
267
-
268
-
269
-
270
-
271
-
272
-
273
-
274
-
275
-
276
-
277
-
278
-
279
-
280
-
281
-
282
-
283
-
284
-
285
-
286
-
287
-
288
-
289
-
290
-
291
-
292
-
293
-
294
-
295
-
296
-
297
-
298
-
299
-
300
-
301
-
302
-
303
-
304
-
305
-
306
-
307
-
308
-
309
-
310
-
311
-
312
-
313
-
314
-
315
-
316
-
317
-
318
-
319
-
320
-
321
-
322
-
323
-
324
-
325
-
326
-
327
-
328
-
329
-
330
-
331
-
332
-
333
-
334
-
335
-
336
-
337
-
338
-
339
-
340
-
341
-
342
 |
 |

125
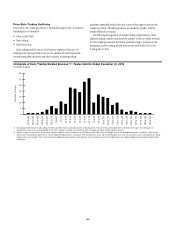
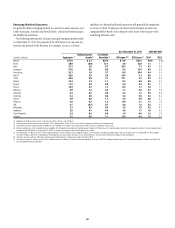
Retail, Small Business and Citi Private Bank
As of December 31, 2013, Citi had approximately $4.7 billion of mostly
locally funded accrual loans to retail, small business and Citi Private Bank
customersintheGIIPS,thevastmajorityofwhichwasinCitiHoldings.
Thiscomparedto$4.5billionasofSeptember30,2013.Ofthe$4.7billion,
approximately (i) $3.3 billion consisted of retail and small business
exposuresinSpain($2.7billion)andGreece($0.6billion),(ii)$0.9billion
related to held-to-maturity securitized retail assets (primarily mortgage-
backedsecuritiesinSpain),and(iii)$0.5billionrelatedtoPrivateBank
customers,substantiallyallinSpain.Thiscomparedtoapproximately
(i)$3.1billionofretailandsmallbusinessexposuresinSpain($2.5billion)
and Greece ($0.6 billion), (ii) $0.9 billion related to held-to-maturity
securitized retail assets, and (iii) $0.5 billion related to Private Bank
customersasofSeptember30,2013.
In addition, Citi had approximately $4.4 billion of unfunded
commitmentstoGIIPSretailcustomersasofDecember31,2013,compared
to$4.1billionasofSeptember30,2013.Citi’sunfundedcommitmentsto
GIIPSretailcustomers,intheformofunusedcreditcardlines,aregenerally
cancellable upon the occurrence of significant credit events, including
redenomination events.
Credit Default Swaps
Citibuysandsellscreditprotectionthroughcreditdefaultswaps(CDS)on
underlyingGIIPSentitiesaspartofitsmarket-makingactivitiesforclients
initstradingportfolios.Citialsopurchasescreditprotection,throughCDS,
to hedge its own credit exposure to these underlying entities that arises from
loans to these entities or derivative transactions with these entities.
CitibuysandsellsCDSaspartofitsmarket-makingactivity,and
purchasesCDSforcreditprotectionprimarilywithinvestmentgrade,global
financialinstitutionspredominantlyoutsidetheGIIPS.Thecounterparty
creditexposurethatcanarisefromthepurchaseorsaleofCDSincludingany
GIIPScounterparties,ismanagedandmitigatedthroughlegallyenforceable
netting and margining agreements with a given counterparty. Thus, the
credit exposure to that counterparty is measured and managed in aggregate
across all products covered by a given netting or margining agreement.
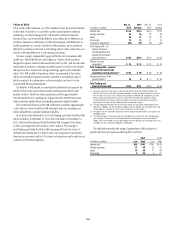
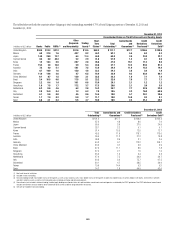
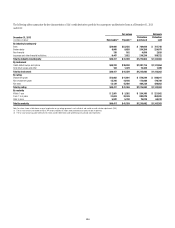
ThenotionalamountofcreditprotectionpurchasedorsoldonGIIPS
underlying single reference entities as of December 31, 2013 is set forth in
the table below. The net notional contract amounts, less mark-to-market
adjustments, are included in “Net current funded exposure” in the table
above and appear in either “Net trading exposure” when part of a trading
strategy or in “Purchased credit protection” when purchased as a hedge
against a credit exposure.
Purchased credit protection generally pays out only upon the occurrence
of certain credit events with respect to the country or borrower covered by
the protection, as determined by a committee composed of dealers and other
market participants. In addition to general counterparty credit risks, the
credit protection may not fully cover all situations that may adversely affect
the value of Citi’s exposure and, accordingly, Citi could still experience losses
despite the existence of the credit protection.
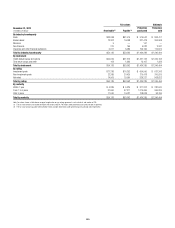
CDS purchased or sold on underlying single reference entities in these countries
In billions of U.S. dollars as of December 31, 2013 GIIPS Greece Ireland Italy Portugal Spain
Notional CDS contracts on underlying reference entities
Net purchased (1) $ (15.5) $ (0.3) $(1.4) $ (10.2) $(2.4) $(5.6)
Net sold (1) 6.8 0.3 1.3 3.4 2.3 4.0
Sovereign underlying reference entity
Net purchased (1) (12.4) (0.0) (0.9) (9.2) (1.7) (3.9)
Net sold (1) 5.0 0.0 0.9 2.5 1.7 3.1
Financial institution underlying reference entity
Net purchased (1) (2.0) — — (1.4) (0.3) (0.8)
Net sold (1) 2.3 — — 1.5 0.4 1.0
Corporate underlying reference entity
Net purchased (1) (3.7) (0.3) (0.5) (1.4) (0.9) (2.1)
Net sold (1) 2.4 0.3 0.5 1.2 0.8 1.1
(1) The summation of notional amounts for each GIIPS country does not equal the notional amount presented in the GIIPS total column in the table above, as additional netting is achieved at the agreement level with a
specific counterparty across various GIIPS countries.