Citibank 2013 Annual Report Download - page 24
Download and view the complete annual report
Please find page 24 of the 2013 Citibank annual report below. You can navigate through the pages in the report by either clicking on the pages listed below, or by using the keyword search tool below to find specific information within the annual report.-
 1
1 -
2
-
3
-
4
-
5
-
6
-
7
-
8
-
9
-
10
-
11
-
12
-
13
-
 14
14 -
 15
15 -
 16
16 -
 17
17 -
 18
18 -
 19
19 -
 20
20 -
 21
21 -
 22
22 -
 23
23 -
 24
24 -
 25
25 -
 26
26 -
 27
27 -
 28
28 -
 29
29 -
 30
30 -
 31
31 -
 32
32 -
 33
33 -
 34
34 -
35
-
36
-
37
-
38
-
39
-
40
-
41
-
42
-
43
-
44
-
45
-
46
-
47
-
48
-
49
-
50
-
51
-
52
-
53
-
54
-
55
-
56
-
57
-
58
-
59
-
60
-
61
-
62
-
63
-
64
-
65
-
66
-
67
-
68
-
69
-
70
-
71
-
72
-
73
-
74
-
75
-
76
-
77
-
78
-
79
-
80
-
81
-
82
-
83
-
84
-
85
-
86
-
87
-
88
-
89
-
90
-
91
-
92
-
93
-
94
-
95
-
96
-
97
-
98
-
99
-
100
-
101
-
102
-
103
-
104
-
105
-
106
-
107
-
108
-
109
-
110
-
111
-
112
-
113
-
114
-
115
-
116
-
117
-
118
-
119
-
120
-
121
-
122
-
123
-
124
-
125
-
126
-
127
-
128
-
129
-
130
-
131
-
132
-
133
-
134
-
135
-
136
-
137
-
138
-
139
-
140
-
141
-
142
-
143
-
144
-
145
-
146
-
147
-
148
-
149
-
150
-
151
-
152
-
153
-
154
-
155
-
156
-
157
-
158
-
159
-
160
-
161
-
162
-
163
-
164
-
165
-
166
-
167
-
168
-
169
-
170
-
171
-
172
-
173
-
174
-
175
-
176
-
177
-
178
-
179
-
180
-
181
-
182
-
183
-
184
-
185
-
186
-
187
-
188
-
189
-
190
-
191
-
192
-
193
-
194
-
195
-
196
-
197
-
198
-
199
-
200
-
201
-
202
-
203
-
204
-
205
-
206
-
207
-
208
-
209
-
210
-
211
-
212
-
213
-
214
-
215
-
216
-
217
-
218
-
219
-
220
-
221
-
222
-
223
-
224
-
225
-
226
-
227
-
228
-
229
-
230
-
231
-
232
-
233
-
234
-
235
-
236
-
237
-
238
-
239
-
240
-
241
-
242
-
243
-
244
-
245
-
246
-
247
-
248
-
249
-
250
-
251
-
252
-
253
-
254
-
255
-
256
-
257
-
258
-
259
-
260
-
261
-
262
-
263
-
264
-
265
-
266
-
267
-
268
-
269
-
270
-
271
-
272
-
273
-
274
-
275
-
276
-
277
-
278
-
279
-
280
-
281
-
282
-
283
-
284
-
285
-
286
-
287
-
288
-
289
-
290
-
291
-
292
-
293
-
294
-
295
-
296
-
297
-
298
-
299
-
300
-
301
-
302
-
303
-
304
-
305
-
306
-
307
-
308
-
309
-
310
-
311
-
312
-
313
-
314
-
315
-
316
-
317
-
318
-
319
-
320
-
321
-
322
-
323
-
324
-
325
-
326
-
327
-
328
-
329
-
330
-
331
-
332
-
333
-
334
-
335
-
336
-
337
-
338
-
339
-
340
-
341
-
342
 |
 |
6
MANAGEMENT’S DISCUSSION AND ANALYSIS OF FINANCIAL CONDITION AND
RESULTS OF OPERATIONS
EXECUTIVE SUMMARY
Overview
2013—Steady Progress on Execution Priorities and Strategy
Despite Continued Challenging Operating Environment
2013 represented a continued challenging operating environment for
Citigroup in several respects, including:
•changing expectations regarding the Federal Reserve Board’s tapering of
quantitative easing and the impact of this uncertainty on the markets,
trading environment and customer activity;
•the increasing costs of legal settlements across the financial services
industry as Citi continued to work through its legacy legal issues; and
•a continued low interest rate environment.
These issues significantly impacted Citi’s results of operations, particularly
during the second half of 2013. Despite these challenges, however, Citi made
progress on its execution priorities as identified in early 2013, including:
•Efficient resource allocation, including disciplined expense
management—During 2013, Citi completed the significant repositioning
actions announced in the fourth quarter of 2012, which resulted in
the exit of markets that do not fit Citi’s strategy and contributed to the
reduction in its operating expenses year-over-year (see discussion below).
•Continued focus on the wind down of Citi Holdings and getting Citi
Holdings closer to “break even”—Citi Holdings’ assets declined by
$39 billion, or 25%, during 2013, and the net loss for this segment
improved by approximately 49% (see discussion below). Citi also was able
to resolve certain of its legacy legal issues during 2013, including entering
into agreements with Fannie Mae and Freddie Mac relating to residential
mortgage representation and warranty repurchase matters.
•Utilization of deferred tax assets (DTAs)—Citi utilized approximately
$2.5 billion of its DTAs during 2013, including $700 million in the
fourth quarter.
While making good progress on these initiatives in 2013, Citi expects the
operating environment in 2014 to remain challenging. Short-term interest
rates likely will remain low for some time, and thus spread compression
could continue to impact most of Citi’s major geographies during the
year. (As used throughout this Form 10-K, spread compression refers to
the reduction in net interest revenue as a percentage of loans or deposits,
as applicable, driven by either lower yields on interest-earning assets or
higher costs to fund such assets, or a combination thereof). Given the
current litigation and regulatory environment, Citi expects its legal and
related expenses will likely remain elevated in 2014. There continues to
be uncertainty regarding tapering by the Federal Reserve Board and its
impact on the markets, including the emerging markets, and global trading
environment. In addition, despite an improved economic environment in
2013, there continues to be questions about the sustainability and pace of
ongoing improvement in various markets. Finally, Citi continues to face
significant regulatory changes, uncertainties and costs in the U.S. and
non-U.S. jurisdictions in which it operates. For a more detailed discussion of
these and other risks that could impact Citi’s businesses, results of operations
and financial condition during 2014, see “Risk Factors” below.
Despite these ongoing challenges, however, Citi remains highly focused
on the continued execution of the priorities discussed above and its strategy,
which continues to be to wind down Citi Holdings as soon as practicable in
an economically rational manner and leverage its unique global network to:
•be a leading provider of financial services to the world’s largest multi-
national corporations and investors; and
•be the preeminent bank for the emerging affluent and affluent consumers
in the world’s largest urban centers.
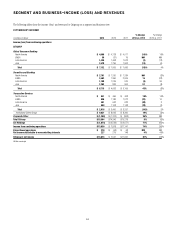
2013 Summary Results
Citigroup
Citigroup reported net income of $13.7 billion and diluted earnings per share
of $4.35 in 2013, compared to $7.5 billion and $2.44 per share, respectively,
in 2012. In 2013, results included a credit valuation adjustment (CVA)
on derivatives (counterparty and own-credit), net of hedges, and debt
valuation adjustment (DVA) on Citi’s fair value option debt of a pretax loss
of $342 million ($213 million after-tax) as Citi’s credit spreads tightened
during the year, compared to a pretax loss of $2.3 billion ($1.4 billion
after-tax) in 2012. Results in the third quarter of 2013 also included a
$176 million tax benefit, compared to a $582 million tax benefit in the
third quarter of 2012, each of which related to the resolution of certain
tax audit items and were recorded in Corporate/Other. In addition, 2013
results included a $189 million after-tax benefit related to the divestiture
of Credicard, Citi’s non-Citibank branded cards and consumer finance
business in Brazil (Credicard), recorded in Corporate/Other (see Note 2 to
the Consolidated Financial Statements). Citigroup’s 2012 results included
a pretax loss of $4.6 billion ($2.9 billion after-tax) related to the sale of
minority investments (for additional information, see “Corporate/Other”
below), as well as approximately $1.0 billion of fourth quarter 2012 pretax
repositioning charges ($653 million after-tax).
Excluding the items above, Citi’s net income was $13.5 billion, or $4.30
per diluted share in 2013, up 11% compared to $11.9 billion, or $3.86
per share, in the prior year, as higher revenues, lower operating expenses and
lower net credit losses were partially offset by a lower net loan loss reserve
release and a higher effective tax rate in 2013 (see Note 9 to the Consolidated
Financial Statements). (Citi’s results of operations excluding the impact
of CVA/DVA, the impact of the Credicard divestiture, the impact of minority
investments, the repositioning charges in the fourth quarter of 2012 and the
impact of the tax benefits, each as discussed above, are non-GAAP financial
measures. Citi believes the presentation of its results of operations excluding
these impacts provides a more meaningful depiction of the underlying
fundamentals of its businesses.)
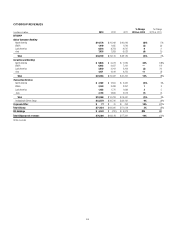
Citi’s revenues, net of interest expense, were $76.4 billion in 2013, up
10% versus the prior year. Excluding CVA/DVA and the impact of minority
investments in 2012, revenues were $76.7 billion, up 1%, as revenues in
Citi Holdings increased 22% compared to the prior year, while revenues in