Citibank 2013 Annual Report Download - page 167
Download and view the complete annual report
Please find page 167 of the 2013 Citibank annual report below. You can navigate through the pages in the report by either clicking on the pages listed below, or by using the keyword search tool below to find specific information within the annual report.-
 1
1 -
2
-
3
-
4
-
5
-
6
-
7
-
8
-
9
-
10
-
11
-
12
-
13
-
14
-
15
-
16
-
17
-
18
-
19
-
20
-
21
-
22
-
23
-
24
-
25
-
26
-
27
-
28
-
29
-
30
-
31
-
32
-
33
-
34
-
35
-
36
-
37
-
38
-
39
-
40
-
41
-
42
-
43
-
44
-
45
-
46
-
47
-
48
-
49
-
50
-
51
-
52
-
53
-
54
-
55
-
56
-
57
-
58
-
59
-
60
-
61
-
62
-
63
-
64
-
65
-
66
-
67
-
68
-
69
-
70
-
71
-
72
-
73
-
74
-
75
-
76
-
77
-
78
-
79
-
80
-
81
-
82
-
83
-
84
-
85
-
86
-
87
-
88
-
89
-
90
-
91
-
92
-
93
-
94
-
95
-
96
-
97
-
98
-
99
-
100
-
101
-
102
-
103
-
104
-
105
-
106
-
107
-
108
-
109
-
110
-
111
-
112
-
113
-
114
-
115
-
116
-
117
-
118
-
119
-
120
-
121
-
122
-
123
-
124
-
125
-
126
-
127
-
128
-
129
-
130
-
131
-
132
-
133
-
134
-
135
-
136
-
137
-
138
-
139
-
140
-
141
-
142
-
143
-
144
-
145
-
146
-
147
-
148
-
149
-
150
-
151
-
152
-
153
-
154
-
155
-
156
-
 157
157 -
 158
158 -
 159
159 -
 160
160 -
 161
161 -
 162
162 -
 163
163 -
 164
164 -
 165
165 -
 166
166 -
 167
167 -
 168
168 -
 169
169 -
 170
170 -
 171
171 -
 172
172 -
 173
173 -
 174
174 -
 175
175 -
 176
176 -
 177
177 -
178
-
179
-
180
-
181
-
182
-
183
-
184
-
185
-
186
-
187
-
188
-
189
-
190
-
191
-
192
-
193
-
194
-
195
-
196
-
197
-
198
-
199
-
200
-
201
-
202
-
203
-
204
-
205
-
206
-
207
-
208
-
209
-
210
-
211
-
212
-
213
-
214
-
215
-
216
-
217
-
218
-
219
-
220
-
221
-
222
-
223
-
224
-
225
-
226
-
227
-
228
-
229
-
230
-
231
-
232
-
233
-
234
-
235
-
236
-
237
-
238
-
239
-
240
-
241
-
242
-
243
-
244
-
245
-
246
-
247
-
248
-
249
-
250
-
251
-
252
-
253
-
254
-
255
-
256
-
257
-
258
-
259
-
260
-
261
-
262
-
263
-
264
-
265
-
266
-
267
-
268
-
269
-
270
-
271
-
272
-
273
-
274
-
275
-
276
-
277
-
278
-
279
-
280
-
281
-
282
-
283
-
284
-
285
-
286
-
287
-
288
-
289
-
290
-
291
-
292
-
293
-
294
-
295
-
296
-
297
-
298
-
299
-
300
-
301
-
302
-
303
-
304
-
305
-
306
-
307
-
308
-
309
-
310
-
311
-
312
-
313
-
314
-
315
-
316
-
317
-
318
-
319
-
320
-
321
-
322
-
323
-
324
-
325
-
326
-
327
-
328
-
329
-
330
-
331
-
332
-
333
-
334
-
335
-
336
-
337
-
338
-
339
-
340
-
341
-
342
 |
 |

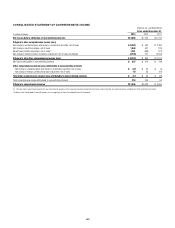
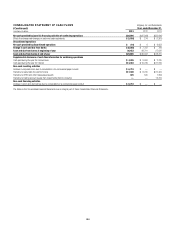
149
CONSOLIDATED STATEMENT OF COMPREHENSIVE INCOME
Citigroup Inc. and Subsidiaries
Years ended December 31,
In millions of dollars 2013 2012 2011
Net income before attribution of noncontrolling interests $13,900 $ 7,760 $11,215
Citigroup’s other comprehensive income (loss)
Net change in unrealized gains and losses on investment securities, net of taxes $ (2,321) $ 632 $ 2,360
Net change in cash flow hedges, net of taxes 1,048 527 (170)
Benefit plans liability adjustment, net of taxes (1) 1,281 (988) (177)
Net change in foreign currency translation adjustment, net of taxes and hedges (2,245) 721 (3,524)
Citigroup’s total other comprehensive income (loss) $ (2,237) $ 892 $ (1,511)
Net income attributable to noncontrolling interests $ 227 $ 219 $ 148
Other comprehensive income (loss) attributable to noncontrolling interests
Net change in unrealized gains and losses on investment securities, net of taxes $ (27) $ 32 $ (5)
Net change in foreign currency translation adjustment, net of taxes 10 58 (87)
Total other comprehensive income (loss) attributable to noncontrolling interests $ (17) $ 90 $ (92)
Total comprehensive income attributable to noncontrolling interests 210 309 56
Citigroup’s comprehensive income $11,436 $ 8,433 $ 9,556
(1) Primarily reflects adjustments based on the year-end actuarial valuations of the Company’s pension and postretirement plans and amortization of amounts previously recognized in Other comprehensive income.
The Notes to the Consolidated Financial Statements are an integral part of these Consolidated Financial Statements.