Citibank 2013 Annual Report Download - page 208
Download and view the complete annual report
Please find page 208 of the 2013 Citibank annual report below. You can navigate through the pages in the report by either clicking on the pages listed below, or by using the keyword search tool below to find specific information within the annual report.-
 1
1 -
2
-
3
-
4
-
5
-
6
-
7
-
8
-
9
-
10
-
11
-
12
-
13
-
14
-
15
-
16
-
17
-
18
-
19
-
20
-
21
-
22
-
23
-
24
-
25
-
26
-
27
-
28
-
29
-
30
-
31
-
32
-
33
-
34
-
35
-
36
-
37
-
38
-
39
-
40
-
41
-
42
-
43
-
44
-
45
-
46
-
47
-
48
-
49
-
50
-
51
-
52
-
53
-
54
-
55
-
56
-
57
-
58
-
59
-
60
-
61
-
62
-
63
-
64
-
65
-
66
-
67
-
68
-
69
-
70
-
71
-
72
-
73
-
74
-
75
-
76
-
77
-
78
-
79
-
80
-
81
-
82
-
83
-
84
-
85
-
86
-
87
-
88
-
89
-
90
-
91
-
92
-
93
-
94
-
95
-
96
-
97
-
98
-
99
-
100
-
101
-
102
-
103
-
104
-
105
-
106
-
107
-
108
-
109
-
110
-
111
-
112
-
113
-
114
-
115
-
116
-
117
-
118
-
119
-
120
-
121
-
122
-
123
-
124
-
125
-
126
-
127
-
128
-
129
-
130
-
131
-
132
-
133
-
134
-
135
-
136
-
137
-
138
-
139
-
140
-
141
-
142
-
143
-
144
-
145
-
146
-
147
-
148
-
149
-
150
-
151
-
152
-
153
-
154
-
155
-
156
-
157
-
158
-
159
-
160
-
161
-
162
-
163
-
164
-
165
-
166
-
167
-
168
-
169
-
170
-
171
-
172
-
173
-
174
-
175
-
176
-
177
-
178
-
179
-
180
-
181
-
182
-
183
-
184
-
185
-
186
-
187
-
188
-
189
-
190
-
191
-
192
-
193
-
194
-
195
-
196
-
197
-
 198
198 -
 199
199 -
 200
200 -
 201
201 -
 202
202 -
 203
203 -
 204
204 -
 205
205 -
 206
206 -
 207
207 -
 208
208 -
 209
209 -
 210
210 -
 211
211 -
 212
212 -
 213
213 -
 214
214 -
 215
215 -
 216
216 -
 217
217 -
 218
218 -
219
-
220
-
221
-
222
-
223
-
224
-
225
-
226
-
227
-
228
-
229
-
230
-
231
-
232
-
233
-
234
-
235
-
236
-
237
-
238
-
239
-
240
-
241
-
242
-
243
-
244
-
245
-
246
-
247
-
248
-
249
-
250
-
251
-
252
-
253
-
254
-
255
-
256
-
257
-
258
-
259
-
260
-
261
-
262
-
263
-
264
-
265
-
266
-
267
-
268
-
269
-
270
-
271
-
272
-
273
-
274
-
275
-
276
-
277
-
278
-
279
-
280
-
281
-
282
-
283
-
284
-
285
-
286
-
287
-
288
-
289
-
290
-
291
-
292
-
293
-
294
-
295
-
296
-
297
-
298
-
299
-
300
-
301
-
302
-
303
-
304
-
305
-
306
-
307
-
308
-
309
-
310
-
311
-
312
-
313
-
314
-
315
-
316
-
317
-
318
-
319
-
320
-
321
-
322
-
323
-
324
-
325
-
326
-
327
-
328
-
329
-
330
-
331
-
332
-
333
-
334
-
335
-
336
-
337
-
338
-
339
-
340
-
341
-
342
 |
 |

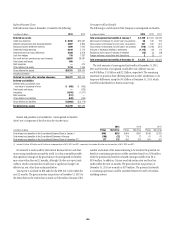
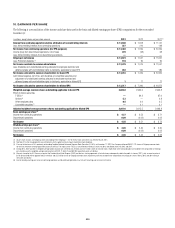
190
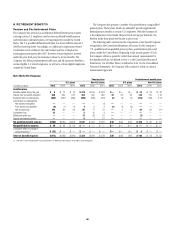
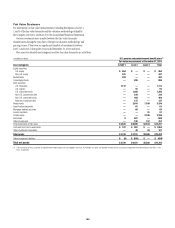
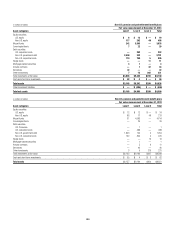
In millions of dollars Non-U.S. pension and postretirement benefit plans
Fair value measurement at December 31, 2013
Asset categories Level 1 Level 2 Level 3 Total
Equity securities
U.S. equity $ 6 $ 13 $ — $ 19
Non-U.S. equity 117 292 49 458
Mutual funds 242 3,593 — 3,835
Commingled funds 7 22 — 29
Debt securities
U.S. corporate bonds — 392 — 392
Non-U.S. government debt 2,559 232 — 2,791
Non-U.S. corporate bonds 110 780 5 895
Hedge funds — — 11 11
Mortgage-backed securities 3 1 — 4
Annuity contracts — 1 32 33
Derivatives 42 — — 42
Other investments 7 12 202 221
Total investments at fair value $3,093 $5,338 $ 299 $ 8,730
Cash and short-term investments $ 92 $ 4 $ — $ 96
Total assets $3,185 $5,342 $299 $ 8,826
Other investment liabilities $ — $ (436) $ — $ (436)
Total net assets $3,185 $4,906 $ 299 $ 8,390
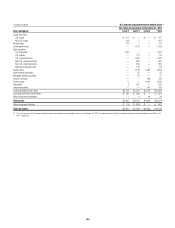
In millions of dollars Non-U.S. pension and postretirement benefit plans
Fair value measurement at December 31, 2012
Asset categories Level 1 Level 2 Level 3 Total
Equity securities
U.S. equity $ 12 $ 12 $ — $ 24
Non-U.S. equity 88 77 48 213
Mutual funds 31 4,583 — 4,614
Commingled funds — 26 — 26
Debt securities
U.S. Treasuries — 1 — 1
U.S. corporate bonds — 488 — 488
Non-U.S. government debt 1,806 144 4 1,954
Non-U.S. corporate bonds 162 804 4 970
Hedge funds — — 16 16
Mortgage-backed securities — 1 — 1
Annuity contracts — 5 6 11
Derivatives — 40 — 40
Other investments 3 9 219 231
Total investments at fair value $2,102 $6,190 $297 $8,589
Cash and short-term investments $ 55 $ 4 $ 3 $ 62
Total assets $2,157 $6,194 $300 $8,651