Citibank 2013 Annual Report Download - page 51
Download and view the complete annual report
Please find page 51 of the 2013 Citibank annual report below. You can navigate through the pages in the report by either clicking on the pages listed below, or by using the keyword search tool below to find specific information within the annual report.-
 1
1 -
2
-
3
-
4
-
5
-
6
-
7
-
8
-
9
-
10
-
11
-
12
-
13
-
14
-
15
-
16
-
17
-
18
-
19
-
20
-
21
-
22
-
23
-
24
-
25
-
26
-
27
-
28
-
29
-
30
-
31
-
32
-
33
-
34
-
35
-
36
-
37
-
38
-
39
-
40
-
 41
41 -
 42
42 -
 43
43 -
 44
44 -
 45
45 -
 46
46 -
 47
47 -
 48
48 -
 49
49 -
 50
50 -
 51
51 -
 52
52 -
 53
53 -
 54
54 -
 55
55 -
 56
56 -
 57
57 -
 58
58 -
 59
59 -
 60
60 -
 61
61 -
62
-
63
-
64
-
65
-
66
-
67
-
68
-
69
-
70
-
71
-
72
-
73
-
74
-
75
-
76
-
77
-
78
-
79
-
80
-
81
-
82
-
83
-
84
-
85
-
86
-
87
-
88
-
89
-
90
-
91
-
92
-
93
-
94
-
95
-
96
-
97
-
98
-
99
-
100
-
101
-
102
-
103
-
104
-
105
-
106
-
107
-
108
-
109
-
110
-
111
-
112
-
113
-
114
-
115
-
116
-
117
-
118
-
119
-
120
-
121
-
122
-
123
-
124
-
125
-
126
-
127
-
128
-
129
-
130
-
131
-
132
-
133
-
134
-
135
-
136
-
137
-
138
-
139
-
140
-
141
-
142
-
143
-
144
-
145
-
146
-
147
-
148
-
149
-
150
-
151
-
152
-
153
-
154
-
155
-
156
-
157
-
158
-
159
-
160
-
161
-
162
-
163
-
164
-
165
-
166
-
167
-
168
-
169
-
170
-
171
-
172
-
173
-
174
-
175
-
176
-
177
-
178
-
179
-
180
-
181
-
182
-
183
-
184
-
185
-
186
-
187
-
188
-
189
-
190
-
191
-
192
-
193
-
194
-
195
-
196
-
197
-
198
-
199
-
200
-
201
-
202
-
203
-
204
-
205
-
206
-
207
-
208
-
209
-
210
-
211
-
212
-
213
-
214
-
215
-
216
-
217
-
218
-
219
-
220
-
221
-
222
-
223
-
224
-
225
-
226
-
227
-
228
-
229
-
230
-
231
-
232
-
233
-
234
-
235
-
236
-
237
-
238
-
239
-
240
-
241
-
242
-
243
-
244
-
245
-
246
-
247
-
248
-
249
-
250
-
251
-
252
-
253
-
254
-
255
-
256
-
257
-
258
-
259
-
260
-
261
-
262
-
263
-
264
-
265
-
266
-
267
-
268
-
269
-
270
-
271
-
272
-
273
-
274
-
275
-
276
-
277
-
278
-
279
-
280
-
281
-
282
-
283
-
284
-
285
-
286
-
287
-
288
-
289
-
290
-
291
-
292
-
293
-
294
-
295
-
296
-
297
-
298
-
299
-
300
-
301
-
302
-
303
-
304
-
305
-
306
-
307
-
308
-
309
-
310
-
311
-
312
-
313
-
314
-
315
-
316
-
317
-
318
-
319
-
320
-
321
-
322
-
323
-
324
-
325
-
326
-
327
-
328
-
329
-
330
-
331
-
332
-
333
-
334
-
335
-
336
-
337
-
338
-
339
-
340
-
341
-
342
 |
 |

33
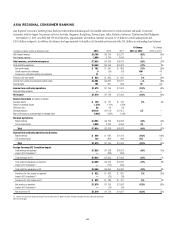
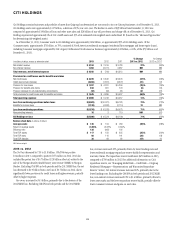
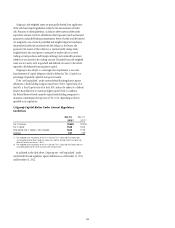
CITI HOLDINGS
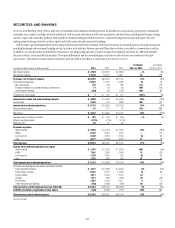
Citi Holdings contains businesses and portfolios of assets that Citigroup has determined are not central to its core Citicorp businesses. As of December 31, 2013,
Citi Holdings assets were approximately $117 billion, a decrease of 25% year-over-year. The decline in assets of $39 billion from December 31, 2012 was
composed of approximately $19 billion of loan and other asset sales and $20 billion of run-off, pay-downs and charge-offs. As of December 31, 2013, Citi
Holdings represented approximately 6% of Citi’s GAAP assets and 19% of its estimated risk-weighted assets under Basel III (based on the “Advanced Approaches”
for determining risk-weighted assets).
As of December 31, 2013, Consumer assets in Citi Holdings were approximately $104 billion, or approximately 89% of Citi Holdings assets. Of the
Consumer assets, approximately $73 billion, or 70%, consisted of North America residential mortgages (residential first mortgages and home equity loans),
including Consumer mortgages originated by Citi’s legacy CitiFinancial North America business (approximately $12 billion, or 16%, of the $73 billion as of
December 31, 2013).
In millions of dollars, except as otherwise noted 2013 2012 2011
% Change
2013 vs. 2012
% Change
2012 vs. 2011
Net interest revenue $ 3,184 $2,619 $ 3,726 22% (30)%
Non-interest revenue 1,358 (3,411) 2,587 NM NM
Total revenues, net of interest expense $ 4,542 $ (792) $ 6,313 NM NM
Provisions for credit losses and for benefits and claims
Net credit losses $ 3,070 $ 5,842 $ 8,576 (47)% (32)%
Credit reserve build (release) (2,033) (1,551) (3,277) (31) 53
Provision for loan losses $ 1,037 $ 4,291 $ 5,299 (76)% (19)%
Provision for benefits and claims 618 651 779 (5) (16)
Provision (release) for unfunded lending commitments (10) (56) (41) 82 (37)
Total provisions for credit losses and for benefits and claims $ 1,645 $ 4,886 $ 6,037 (66)% (19)%
Total operating expenses $ 5,900 $ 5,243 $ 6,457 13% (19)%
Loss from continuing operations before taxes $(3,003) $(10,921) $(6,181) 73% (77)%
Benefits for income taxes (1,129) (4,393) (2,110) 74 NM
Loss from continuing operations $(1,874) $ (6,528) $(4,071) 71% (60)%
Noncontrolling interests 16 3 119 NM (97)
Citi Holdings net loss $(1,890) $ (6,531) $(4,190) 71% (56)%
Balance sheet data (in billions of dollars)
Average assets $ 136 $ 194 $ 269 (30)% (28)%
Return on average assets (1.39)% (3.37)% (1.56)%
Efficiency ratio 130 (662) 102
Total EOP assets $ 117 $ 156 $ 225 (25)% (31)%
Total EOP loans 93 116 141 (20) (18)
Total EOP deposits 36 68 62 (47) 10
NM Not meaningful
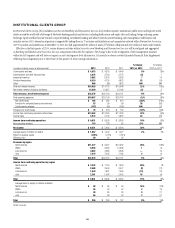
2013 vs. 2012
The Net loss decreased by 71% to $1.9 billion. CVA/DVA was positive
$3 million in 2013, compared to positive $157 million in 2012. 2012 also
included the pretax loss of $4.7 billion ($2.9 billion after-tax) related to the
sale of the Morgan Stanley Smith Barney joint venture (MSSB) to Morgan
Stanley. Excluding CVA/DVA in both periods and the 2012 MSSB loss, the net
loss decreased to $1.9 billion from a net loss of $3.7 billion in 2012, due to
significantly lower provisions for credit losses and higher revenues, partially
offset by higher expenses.
Revenues increased to $4.5 billion, primarily due to the absence of the
2012 MSSB loss. Excluding CVA/DVA in both periods and the 2012 MSSB
loss, revenues increased 22%, primarily driven by lower funding costs and
lower residential mortgage repurchase reserve builds for representation and
warranty claims. The repurchase reserve builds were $470 million in 2013,
compared to $700 million in 2012 (for additional information on Citi’s
repurchase reserve, see “Managing Global Risk—Credit Risk—Citigroup
Residential Mortgages—Representations and Warranties Repurchase
Reserve” below). Net interest revenues increased 22%, primarily due to the
lower funding costs. Excluding the CVA/DVA in both periods and 2012 MSSB
loss, non-interest revenues increased 21% to $1.4 billion, primarily driven by
lower asset marks and the lower repurchase reserve builds, partially offset by
lower consumer revenues and gains on asset sales.