Citibank 2013 Annual Report Download - page 102
Download and view the complete annual report
Please find page 102 of the 2013 Citibank annual report below. You can navigate through the pages in the report by either clicking on the pages listed below, or by using the keyword search tool below to find specific information within the annual report.-
 1
1 -
2
-
3
-
4
-
5
-
6
-
7
-
8
-
9
-
10
-
11
-
12
-
13
-
14
-
15
-
16
-
17
-
18
-
19
-
20
-
21
-
22
-
23
-
24
-
25
-
26
-
27
-
28
-
29
-
30
-
31
-
32
-
33
-
34
-
35
-
36
-
37
-
38
-
39
-
40
-
41
-
42
-
43
-
44
-
45
-
46
-
47
-
48
-
49
-
50
-
51
-
52
-
53
-
54
-
55
-
56
-
57
-
58
-
59
-
60
-
61
-
62
-
63
-
64
-
65
-
66
-
67
-
68
-
69
-
70
-
71
-
72
-
73
-
74
-
75
-
76
-
77
-
78
-
79
-
80
-
81
-
82
-
83
-
84
-
85
-
86
-
87
-
88
-
89
-
90
-
91
-
 92
92 -
 93
93 -
 94
94 -
 95
95 -
 96
96 -
 97
97 -
 98
98 -
 99
99 -
 100
100 -
 101
101 -
 102
102 -
 103
103 -
 104
104 -
 105
105 -
 106
106 -
 107
107 -
 108
108 -
 109
109 -
 110
110 -
 111
111 -
 112
112 -
113
-
114
-
115
-
116
-
117
-
118
-
119
-
120
-
121
-
122
-
123
-
124
-
125
-
126
-
127
-
128
-
129
-
130
-
131
-
132
-
133
-
134
-
135
-
136
-
137
-
138
-
139
-
140
-
141
-
142
-
143
-
144
-
145
-
146
-
147
-
148
-
149
-
150
-
151
-
152
-
153
-
154
-
155
-
156
-
157
-
158
-
159
-
160
-
161
-
162
-
163
-
164
-
165
-
166
-
167
-
168
-
169
-
170
-
171
-
172
-
173
-
174
-
175
-
176
-
177
-
178
-
179
-
180
-
181
-
182
-
183
-
184
-
185
-
186
-
187
-
188
-
189
-
190
-
191
-
192
-
193
-
194
-
195
-
196
-
197
-
198
-
199
-
200
-
201
-
202
-
203
-
204
-
205
-
206
-
207
-
208
-
209
-
210
-
211
-
212
-
213
-
214
-
215
-
216
-
217
-
218
-
219
-
220
-
221
-
222
-
223
-
224
-
225
-
226
-
227
-
228
-
229
-
230
-
231
-
232
-
233
-
234
-
235
-
236
-
237
-
238
-
239
-
240
-
241
-
242
-
243
-
244
-
245
-
246
-
247
-
248
-
249
-
250
-
251
-
252
-
253
-
254
-
255
-
256
-
257
-
258
-
259
-
260
-
261
-
262
-
263
-
264
-
265
-
266
-
267
-
268
-
269
-
270
-
271
-
272
-
273
-
274
-
275
-
276
-
277
-
278
-
279
-
280
-
281
-
282
-
283
-
284
-
285
-
286
-
287
-
288
-
289
-
290
-
291
-
292
-
293
-
294
-
295
-
296
-
297
-
298
-
299
-
300
-
301
-
302
-
303
-
304
-
305
-
306
-
307
-
308
-
309
-
310
-
311
-
312
-
313
-
314
-
315
-
316
-
317
-
318
-
319
-
320
-
321
-
322
-
323
-
324
-
325
-
326
-
327
-
328
-
329
-
330
-
331
-
332
-
333
-
334
-
335
-
336
-
337
-
338
-
339
-
340
-
341
-
342
 |
 |
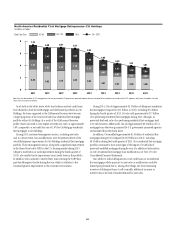
84
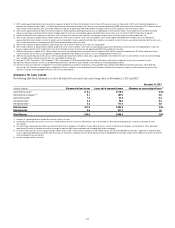
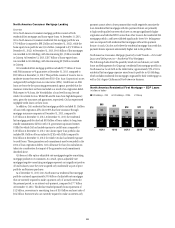
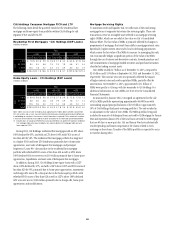
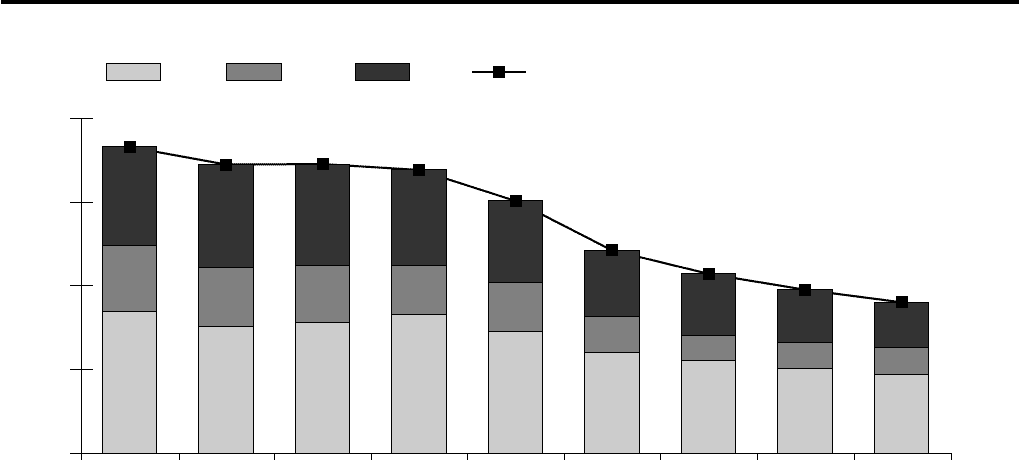
North America Residential First Mortgage Delinquencies—Citi Holdings
In billions of dollars
Days Past Due:
0
2
4
6
8
30+ DPD
180+
90-179
30-89
4Q133Q132Q131Q134Q123Q122Q121Q124Q11
3.39 3.02 3.13 3.33 2.91 2.41 2.21 2.02 1.88
1.57 1.41 1.37 1.16 1.17
0.85 0.61 0.63 0.64
2.36
2.47 2.41 2.28
1.95
1.59
1.47
1.09
1.26
7.32
6.90 6.91 6.77
6.03
4.85
4.29 3.91 3.61
Note: Days past due excludes (i) U.S. mortgage loans that are guaranteed by U.S. government-sponsored agencies because the potential loss predominantly resides with the U.S. agencies, and (ii) loans recorded at fair value.
Totals may not sum due to rounding.
As set forth in the tables above, while loan balances and net credit losses
have declined in both the CitiMortgage and CitiFinancial portfolios in Citi
Holdings, the loans originated in the CitiFinancial business have become
a larger proportion of the total North America residential first mortgage
portfolio within Citi Holdings. As a result of the CitiFinancial borrower
profile, these loans tend to have higher net credit loss rates, at approximately
5.0%, compared to a net credit loss rate of 1.0% for CitiMortgage residential
first mortgages in Citi Holdings.
During 2013, continued management actions, including asset sales
and, to a lesser extent, loan modifications, were the primary drivers of the
overall delinquency improvement for Citi Holdings residential first mortgage
portfolio. These management actions, along with a significant improvement
in the Home Price Index (HPI) in the U.S. housing market during 2013
(despite a moderation in such improvement during the fourth quarter of
2013), also resulted in the improvement in net credit losses in the portfolio.
In addition, Citi continued to observe fewer loans entering the 30-89 days
past due delinquency bucket during the year, which it attributes to the
continued general improvement in the economic environment.
During 2013, Citi sold approximately $2.3 billion of delinquent residential
first mortgages (compared to $2.1 billion in 2012), including $0.2 billion
during the fourth quarter of 2013. Citi also sold approximately $3.7 billion
of re-performing residential first mortgages during 2013, although, as
previously disclosed, sales of re-performing residential first mortgages tend
to be yield sensitive. Additionally, Citi sold approximately $0.2 billion of U.S.
mortgage loans that were guaranteed by U.S. government sponsored agencies
and excluded from the charts above.
In addition, Citi modified approximately $1.4 billion of residential first
mortgages during 2013 (compared to $0.9 billion in 2012), including
$0.3 billion during the fourth quarter of 2013. Citi’s residential first mortgage
portfolio continued to show some signs of the impact of re-defaults of
previously modified mortgages during the year. For additional information
on Citi’s residential first mortgage loan modifications, see Note 15 to the
Consolidated Financial Statements.
Citi’s ability to reduce delinquencies or net credit losses in its residential
first mortgage portfolio pursuant to asset sales or modifications could be
limited going forward due to, among other things, the lower remaining
inventory of delinquent loans to sell or modify, additional increases in
interest rates or the lack of market demand for asset sales.