Citibank 2013 Annual Report Download - page 117
Download and view the complete annual report
Please find page 117 of the 2013 Citibank annual report below. You can navigate through the pages in the report by either clicking on the pages listed below, or by using the keyword search tool below to find specific information within the annual report.-
 1
1 -
2
-
3
-
4
-
5
-
6
-
7
-
8
-
9
-
10
-
11
-
12
-
13
-
14
-
15
-
16
-
17
-
18
-
19
-
20
-
21
-
22
-
23
-
24
-
25
-
26
-
27
-
28
-
29
-
30
-
31
-
32
-
33
-
34
-
35
-
36
-
37
-
38
-
39
-
40
-
41
-
42
-
43
-
44
-
45
-
46
-
47
-
48
-
49
-
50
-
51
-
52
-
53
-
54
-
55
-
56
-
57
-
58
-
59
-
60
-
61
-
62
-
63
-
64
-
65
-
66
-
67
-
68
-
69
-
70
-
71
-
72
-
73
-
74
-
75
-
76
-
77
-
78
-
79
-
80
-
81
-
82
-
83
-
84
-
85
-
86
-
87
-
88
-
89
-
90
-
91
-
92
-
93
-
94
-
95
-
96
-
97
-
98
-
99
-
100
-
101
-
102
-
103
-
104
-
105
-
106
-
 107
107 -
 108
108 -
 109
109 -
 110
110 -
 111
111 -
 112
112 -
 113
113 -
 114
114 -
 115
115 -
 116
116 -
 117
117 -
 118
118 -
 119
119 -
 120
120 -
 121
121 -
 122
122 -
 123
123 -
 124
124 -
 125
125 -
 126
126 -
 127
127 -
128
-
129
-
130
-
131
-
132
-
133
-
134
-
135
-
136
-
137
-
138
-
139
-
140
-
141
-
142
-
143
-
144
-
145
-
146
-
147
-
148
-
149
-
150
-
151
-
152
-
153
-
154
-
155
-
156
-
157
-
158
-
159
-
160
-
161
-
162
-
163
-
164
-
165
-
166
-
167
-
168
-
169
-
170
-
171
-
172
-
173
-
174
-
175
-
176
-
177
-
178
-
179
-
180
-
181
-
182
-
183
-
184
-
185
-
186
-
187
-
188
-
189
-
190
-
191
-
192
-
193
-
194
-
195
-
196
-
197
-
198
-
199
-
200
-
201
-
202
-
203
-
204
-
205
-
206
-
207
-
208
-
209
-
210
-
211
-
212
-
213
-
214
-
215
-
216
-
217
-
218
-
219
-
220
-
221
-
222
-
223
-
224
-
225
-
226
-
227
-
228
-
229
-
230
-
231
-
232
-
233
-
234
-
235
-
236
-
237
-
238
-
239
-
240
-
241
-
242
-
243
-
244
-
245
-
246
-
247
-
248
-
249
-
250
-
251
-
252
-
253
-
254
-
255
-
256
-
257
-
258
-
259
-
260
-
261
-
262
-
263
-
264
-
265
-
266
-
267
-
268
-
269
-
270
-
271
-
272
-
273
-
274
-
275
-
276
-
277
-
278
-
279
-
280
-
281
-
282
-
283
-
284
-
285
-
286
-
287
-
288
-
289
-
290
-
291
-
292
-
293
-
294
-
295
-
296
-
297
-
298
-
299
-
300
-
301
-
302
-
303
-
304
-
305
-
306
-
307
-
308
-
309
-
310
-
311
-
312
-
313
-
314
-
315
-
316
-
317
-
318
-
319
-
320
-
321
-
322
-
323
-
324
-
325
-
326
-
327
-
328
-
329
-
330
-
331
-
332
-
333
-
334
-
335
-
336
-
337
-
338
-
339
-
340
-
341
-
342
 |
 |
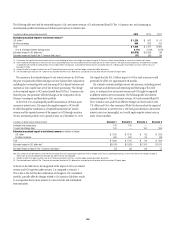
99
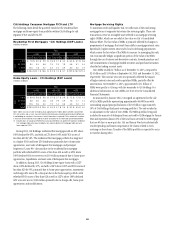
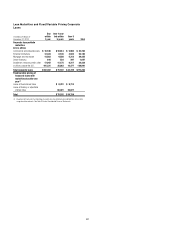
High-Quality Liquid Assets
Parent Significant Citibank Entities
Other Citibank and
Banamex Entities Total
In billions of dollars
Dec. 31,
2013
Sept. 30,
2013
Dec. 31,
2012
Dec. 31,
2013
Sept. 30,
2013
Dec. 31,
2012
Dec. 31,
2013
Sept. 30,
2013
Dec. 31,
2012
Dec. 31,
2013
Sept. 30,
2013
Dec. 31,
2012
Available cash $38.4 $40.7 $33.2 $ 82.6 $ 84.1 $ 25.1 $15.6 $11.5 $11.2 $ 136.6 $136.3 $ 69.5
Unencumbered liquid securities 28.1 24.2 33.7 181.2 172.9 173.0 77.8 76.2 83.5 287.1 273.3 290.2
Total $66.5 $64.9 $66.9 $263.8 $ 257.0 $ 198.1 $93.4 $87.7 $94.7 $ 423.7 $ 409.6 $ 359.7
Note: Amounts above are estimated based on Citi’s current interpretation of the definition of “high-quality liquid assets” under the Basel Committee on Banking Supervision’s final Basel III Liquidity Coverage Ratio rules (see
“Risk Factors—Liquidity Risks” above and “Liquidity Management, Measurement and Stress Testing” below). All amounts in the table above are as of period-end and may increase or decrease intra-period in the ordinary
course of business.
As set forth in the table above, Citigroup’s liquidity resources at
December 31, 2013 increased from both September 30, 2013 and
December 31, 2012. At the end of 2012, Citi had purposefully decreased
its liquidity resources, primarily through long-term debt reductions and a
one-time cash outflow on deposits related to the expiration of the FDIC’s
Transaction Account Guarantee program. The growth in Citi’s liquidity
resources during 2013 was primarily driven by increased deposits (see
“Deposits” below), credit card securitization issuances through Citibank, N.A.
and a continued reduction of Citi Holdings assets, partially offset by Global
Consumer Banking and Securities and Banking lending growth.
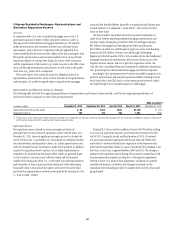
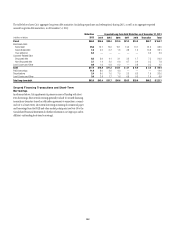
The following table shows further detail of the composition of Citi’s
liquidity resources by type of asset for each of the periods indicated. For
securities, the amounts represent the liquidity value that potentially could be
realized and thus excludes any securities that are encumbered, as well as the
haircuts that would be required for securities sales or financing transactions.
In billions of dollars
Dec. 31,
2013
Sept 30,
2013
Dec. 31,
2012
Available cash $136.6 $136.3 $ 69.5
U.S. Treasuries 89.4 77.8 93.2
U.S. Agencies/Agency MBS 59.2 58.3 62.8
Foreign Government (1) 123.0 121.2 120.8
Other Investment Grade (2) 15.5 16.0 13.4
Total $423.7 $409.6 $ 359.7
(1) Foreign government also includes foreign government agencies, multinationals and foreign
government guaranteed securities. Foreign government securities are held largely to support local
liquidity requirements and Citi’s local franchises and, as of December 31, 2013, principally included
government bonds from Brazil, Hong Kong, India, Japan, Korea, Poland, Mexico, Singapore, Taiwan
and the United Kingdom.
(2) Includes contractual committed facilities from central banks in the amount of $1 billion and $0.9
billion at the end of the fourth and third quarters of 2013, respectively.
As evident from the table above, as of December 31, 2013, more than
80% of Citi’s liquidity resources consisted of available cash, U.S. government
securities and high-quality foreign sovereign debt securities, with the
remaining amounts consisting of U.S. agency securities, agency MBS and
investment grade debt.
Citi’s liquidity resources as set forth above do not include additional
potential liquidity in the form of Citigroup’s borrowing capacity from the
various Federal Home Loan Banks (FHLB), which was approximately
$30 billion as of December 31, 2013 and is maintained by pledged collateral
to all such banks. The liquidity resources shown above also do not include
Citi’s borrowing capacity at the U.S. Federal Reserve Bank discount window
or international central banks, which capacity would be in addition to the
resources noted above.
In general, Citigroup can freely fund legal entities within its bank
vehicles. Citigroup’s bank subsidiaries, including Citibank, N.A., can lend
to the Citigroup parent and broker-dealer entities in accordance with
Section 23A of the Federal Reserve Act. As of December 31, 2013, the amount
available for lending to these entities under Section 23A was approximately
$17 billion (unchanged from September 30, 2013), provided the funds are
collateralized appropriately.