Citibank 2013 Annual Report Download - page 225
Download and view the complete annual report
Please find page 225 of the 2013 Citibank annual report below. You can navigate through the pages in the report by either clicking on the pages listed below, or by using the keyword search tool below to find specific information within the annual report.-
 1
1 -
2
-
3
-
4
-
5
-
6
-
7
-
8
-
9
-
10
-
11
-
12
-
13
-
14
-
15
-
16
-
17
-
18
-
19
-
20
-
21
-
22
-
23
-
24
-
25
-
26
-
27
-
28
-
29
-
30
-
31
-
32
-
33
-
34
-
35
-
36
-
37
-
38
-
39
-
40
-
41
-
42
-
43
-
44
-
45
-
46
-
47
-
48
-
49
-
50
-
51
-
52
-
53
-
54
-
55
-
56
-
57
-
58
-
59
-
60
-
61
-
62
-
63
-
64
-
65
-
66
-
67
-
68
-
69
-
70
-
71
-
72
-
73
-
74
-
75
-
76
-
77
-
78
-
79
-
80
-
81
-
82
-
83
-
84
-
85
-
86
-
87
-
88
-
89
-
90
-
91
-
92
-
93
-
94
-
95
-
96
-
97
-
98
-
99
-
100
-
101
-
102
-
103
-
104
-
105
-
106
-
107
-
108
-
109
-
110
-
111
-
112
-
113
-
114
-
115
-
116
-
117
-
118
-
119
-
120
-
121
-
122
-
123
-
124
-
125
-
126
-
127
-
128
-
129
-
130
-
131
-
132
-
133
-
134
-
135
-
136
-
137
-
138
-
139
-
140
-
141
-
142
-
143
-
144
-
145
-
146
-
147
-
148
-
149
-
150
-
151
-
152
-
153
-
154
-
155
-
156
-
157
-
158
-
159
-
160
-
161
-
162
-
163
-
164
-
165
-
166
-
167
-
168
-
169
-
170
-
171
-
172
-
173
-
174
-
175
-
176
-
177
-
178
-
179
-
180
-
181
-
182
-
183
-
184
-
185
-
186
-
187
-
188
-
189
-
190
-
191
-
192
-
193
-
194
-
195
-
196
-
197
-
198
-
199
-
200
-
201
-
202
-
203
-
204
-
205
-
206
-
207
-
208
-
209
-
210
-
211
-
212
-
213
-
214
-
 215
215 -
 216
216 -
 217
217 -
 218
218 -
 219
219 -
 220
220 -
 221
221 -
 222
222 -
 223
223 -
 224
224 -
 225
225 -
 226
226 -
 227
227 -
 228
228 -
 229
229 -
 230
230 -
 231
231 -
 232
232 -
 233
233 -
 234
234 -
 235
235 -
236
-
237
-
238
-
239
-
240
-
241
-
242
-
243
-
244
-
245
-
246
-
247
-
248
-
249
-
250
-
251
-
252
-
253
-
254
-
255
-
256
-
257
-
258
-
259
-
260
-
261
-
262
-
263
-
264
-
265
-
266
-
267
-
268
-
269
-
270
-
271
-
272
-
273
-
274
-
275
-
276
-
277
-
278
-
279
-
280
-
281
-
282
-
283
-
284
-
285
-
286
-
287
-
288
-
289
-
290
-
291
-
292
-
293
-
294
-
295
-
296
-
297
-
298
-
299
-
300
-
301
-
302
-
303
-
304
-
305
-
306
-
307
-
308
-
309
-
310
-
311
-
312
-
313
-
314
-
315
-
316
-
317
-
318
-
319
-
320
-
321
-
322
-
323
-
324
-
325
-
326
-
327
-
328
-
329
-
330
-
331
-
332
-
333
-
334
-
335
-
336
-
337
-
338
-
339
-
340
-
341
-
342
 |
 |

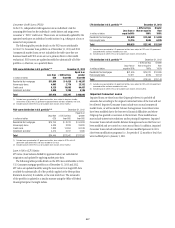
207
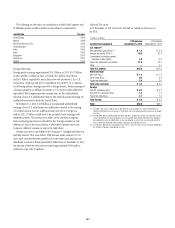
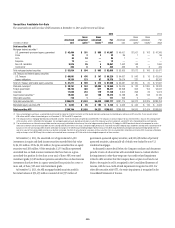
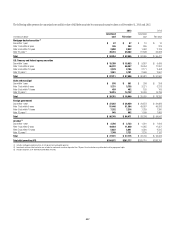
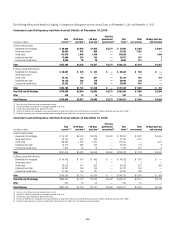
The following table presents the amortized cost and fair value of AFS debt securities by contractual maturity dates as of December 31, 2013 and 2012:
2013 2012
In millions of dollars
Amortized
cost Fair value
Amortized
cost Fair value
Mortgage-backed securities (1)
Due within 1 year $ 87 $ 87 $ 10 $ 10
After 1 but within 5 years 346 354 365 374
After 5 but within 10 years 2,898 2,932 1,992 2,124
After 10 years (2) 49,723 49,282 51,598 52,963
Total $ 53,054 $ 52,655 $ 53,965 $ 55,471
U.S. Treasury and federal agency securities
Due within 1 year $ 15,789 $ 15,853 $ 9,387 $ 9,499
After 1 but within 5 years 66,232 66,457 76,454 77,267
After 5 but within 10 years 2,129 2,185 2,171 2,408
After 10 years (2) 3,061 3,101 2,669 2,667
Total $ 87,211 $ 87,596 $ 90,681 $ 91,841
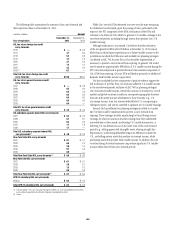
State and municipal
Due within 1 year $ 576 $ 581 $ 208 $ 208
After 1 but within 5 years 3,731 3,735 3,221 3,223
After 5 but within 10 years 439 482 155 165
After 10 years (2) 16,015 14,142 16,436 14,736
Total $ 20,761 $ 18,940 $ 20,020 $ 18,332
Foreign government
Due within 1 year $ 37,022 $ 36,959 $ 34,873 $ 34,869
After 1 but within 5 years 51,446 51,304 49,587 49,933
After 5 but within 10 years 7,332 7,216 7,239 7,380
After 10 years (2) 945 992 1,599 1,865
Total $ 96,745 $ 96,471 $ 93,298 $ 94,047
All other (3)
Due within 1 year $ 2,786 $ 2,733 $ 1,001 $ 1,009
After 1 but within 5 years 10,934 11,020 11,285 11,351
After 5 but within 10 years 5,632 5,641 4,330 4,505
After 10 years (2) 7,749 7,721 7,130 7,197
Total $ 27,101 $ 27,115 $ 23,746 $ 24,062
Total debt securities AFS $284,872 $282,777 $281,710 $283,753
(1) Includes mortgage-backed securities of U.S. government-sponsored agencies.
(2) Investments with no stated maturities are included as contractual maturities of greater than 10 years. Actual maturities may differ due to call or prepayment rights.
(3) Includes corporate, asset-backed and other debt securities.