Citibank 2013 Annual Report Download - page 34
Download and view the complete annual report
Please find page 34 of the 2013 Citibank annual report below. You can navigate through the pages in the report by either clicking on the pages listed below, or by using the keyword search tool below to find specific information within the annual report.-
 1
1 -
2
-
3
-
4
-
5
-
6
-
7
-
8
-
9
-
10
-
11
-
12
-
13
-
14
-
15
-
16
-
17
-
18
-
19
-
20
-
21
-
22
-
23
-
 24
24 -
 25
25 -
 26
26 -
 27
27 -
 28
28 -
 29
29 -
 30
30 -
 31
31 -
 32
32 -
 33
33 -
 34
34 -
 35
35 -
 36
36 -
 37
37 -
 38
38 -
 39
39 -
 40
40 -
 41
41 -
 42
42 -
 43
43 -
 44
44 -
45
-
46
-
47
-
48
-
49
-
50
-
51
-
52
-
53
-
54
-
55
-
56
-
57
-
58
-
59
-
60
-
61
-
62
-
63
-
64
-
65
-
66
-
67
-
68
-
69
-
70
-
71
-
72
-
73
-
74
-
75
-
76
-
77
-
78
-
79
-
80
-
81
-
82
-
83
-
84
-
85
-
86
-
87
-
88
-
89
-
90
-
91
-
92
-
93
-
94
-
95
-
96
-
97
-
98
-
99
-
100
-
101
-
102
-
103
-
104
-
105
-
106
-
107
-
108
-
109
-
110
-
111
-
112
-
113
-
114
-
115
-
116
-
117
-
118
-
119
-
120
-
121
-
122
-
123
-
124
-
125
-
126
-
127
-
128
-
129
-
130
-
131
-
132
-
133
-
134
-
135
-
136
-
137
-
138
-
139
-
140
-
141
-
142
-
143
-
144
-
145
-
146
-
147
-
148
-
149
-
150
-
151
-
152
-
153
-
154
-
155
-
156
-
157
-
158
-
159
-
160
-
161
-
162
-
163
-
164
-
165
-
166
-
167
-
168
-
169
-
170
-
171
-
172
-
173
-
174
-
175
-
176
-
177
-
178
-
179
-
180
-
181
-
182
-
183
-
184
-
185
-
186
-
187
-
188
-
189
-
190
-
191
-
192
-
193
-
194
-
195
-
196
-
197
-
198
-
199
-
200
-
201
-
202
-
203
-
204
-
205
-
206
-
207
-
208
-
209
-
210
-
211
-
212
-
213
-
214
-
215
-
216
-
217
-
218
-
219
-
220
-
221
-
222
-
223
-
224
-
225
-
226
-
227
-
228
-
229
-
230
-
231
-
232
-
233
-
234
-
235
-
236
-
237
-
238
-
239
-
240
-
241
-
242
-
243
-
244
-
245
-
246
-
247
-
248
-
249
-
250
-
251
-
252
-
253
-
254
-
255
-
256
-
257
-
258
-
259
-
260
-
261
-
262
-
263
-
264
-
265
-
266
-
267
-
268
-
269
-
270
-
271
-
272
-
273
-
274
-
275
-
276
-
277
-
278
-
279
-
280
-
281
-
282
-
283
-
284
-
285
-
286
-
287
-
288
-
289
-
290
-
291
-
292
-
293
-
294
-
295
-
296
-
297
-
298
-
299
-
300
-
301
-
302
-
303
-
304
-
305
-
306
-
307
-
308
-
309
-
310
-
311
-
312
-
313
-
314
-
315
-
316
-
317
-
318
-
319
-
320
-
321
-
322
-
323
-
324
-
325
-
326
-
327
-
328
-
329
-
330
-
331
-
332
-
333
-
334
-
335
-
336
-
337
-
338
-
339
-
340
-
341
-
342
 |
 |

16
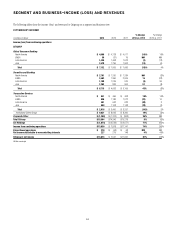
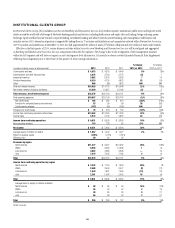
GLOBAL CONSUMER BANKING
Global Consumer Banking (GCB) consists of Citigroup’s four geographical Regional Consumer Banking (RCB) businesses that provide traditional banking
services to retail customers through retail banking, commercial banking, Citi-branded cards and Citi retail services. GCB is a globally diversified business with
3,729 branches in 36 countries around the world as of December 31, 2013. For the year ended December 31, 2013, GCB had approximately $395 billion of
average assets and $328 billion of average deposits.
GCB’s overall strategy is to leverage Citi’s global footprint and seek to be the preeminent bank for the emerging affluent and affluent consumers in large
urban centers. As of December 31, 2013, Citi had consumer banking operations in 121, or 81%, of the world’s top 150 cities. In credit cards and in certain retail
markets, Citi serves customers in a somewhat broader set of segments and geographies. Consistent with its overall strategy, Citi intends to continue to optimize
its branch footprint and further concentrate its presence in major metropolitan areas.
In millions of dollars except as otherwise noted 2013 2012 2011
% Change
2013 vs. 2012
% Change
2012 vs. 2011
Net interest revenue $28,668 $28,686 $ 28,930 —% (1)%
Non-interest revenue 9,501 10,434 9,195 (9) 13
Total revenues, net of interest expense $38,169 $ 39,120 $38,125 (2)% 3%
Total operating expenses $20,608 $ 21,316 $ 20,753 (3)% 3%
Net credit losses $ 7,211 $ 8,107 $10,489 (11)% (23)%
Credit reserve build (release) (669) (2,176) (4,515) 69 52
Provisions for unfunded lending commitments 37 — 3 —(100)
Provision for benefits and claims 212 237 192 (11) 23
Provisions for credit losses and for benefits and claims $ 6,791 $ 6,168 $ 6,169 10% —%
Income from continuing operations before taxes $10,770 $11,636 $ 11,203 (7)% 4%
Income taxes 3,638 3,681 3,537 (1) 4
Income from continuing operations $ 7,132 $ 7,955 $ 7,666 (10)% 4%
Noncontrolling interests 17 3 — NM —
Net income $ 7,115 $ 7,952 $ 7,666 (11)% 4%
Balance Sheet data (in billions of dollars)
Average assets $ 395 $ 388 $ 377 2% 3%
Return on average assets 1.81% 2.07% 2.06%
Efficiency ratio 54 54 54
Total EOP assets $ 405 $ 404 $ 385 —5
Average deposits 328 322 314 23
Net credit losses as a percentage of average loans 2.50% 2.87% 3.85%
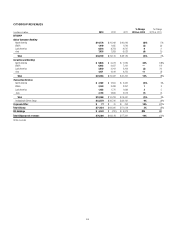
Revenue by business
Retail banking $16,945 $ 18,182 $ 16,517 (7)% 10%
Cards (1) 21,224 20,938 21,608 1(3)
Total 38,169 39,120 38,125 (2)% 3%
Income from continuing operations by business
Retail banking $ 2,136 $ 3,048 $ 2,591 (30)% 18%
Cards (1) 4,996 4,907 5,075 2(3)
Total $ 7,132 $ 7,955 $ 7,666 (10)% 4%
(Table continues on following page).