Citibank 2013 Annual Report Download - page 110
Download and view the complete annual report
Please find page 110 of the 2013 Citibank annual report below. You can navigate through the pages in the report by either clicking on the pages listed below, or by using the keyword search tool below to find specific information within the annual report.-
 1
1 -
2
-
3
-
4
-
5
-
6
-
7
-
8
-
9
-
10
-
11
-
12
-
13
-
14
-
15
-
16
-
17
-
18
-
19
-
20
-
21
-
22
-
23
-
24
-
25
-
26
-
27
-
28
-
29
-
30
-
31
-
32
-
33
-
34
-
35
-
36
-
37
-
38
-
39
-
40
-
41
-
42
-
43
-
44
-
45
-
46
-
47
-
48
-
49
-
50
-
51
-
52
-
53
-
54
-
55
-
56
-
57
-
58
-
59
-
60
-
61
-
62
-
63
-
64
-
65
-
66
-
67
-
68
-
69
-
70
-
71
-
72
-
73
-
74
-
75
-
76
-
77
-
78
-
79
-
80
-
81
-
82
-
83
-
84
-
85
-
86
-
87
-
88
-
89
-
90
-
91
-
92
-
93
-
94
-
95
-
96
-
97
-
98
-
99
-
 100
100 -
 101
101 -
 102
102 -
 103
103 -
 104
104 -
 105
105 -
 106
106 -
 107
107 -
 108
108 -
 109
109 -
 110
110 -
 111
111 -
 112
112 -
 113
113 -
 114
114 -
 115
115 -
 116
116 -
 117
117 -
 118
118 -
 119
119 -
 120
120 -
121
-
122
-
123
-
124
-
125
-
126
-
127
-
128
-
129
-
130
-
131
-
132
-
133
-
134
-
135
-
136
-
137
-
138
-
139
-
140
-
141
-
142
-
143
-
144
-
145
-
146
-
147
-
148
-
149
-
150
-
151
-
152
-
153
-
154
-
155
-
156
-
157
-
158
-
159
-
160
-
161
-
162
-
163
-
164
-
165
-
166
-
167
-
168
-
169
-
170
-
171
-
172
-
173
-
174
-
175
-
176
-
177
-
178
-
179
-
180
-
181
-
182
-
183
-
184
-
185
-
186
-
187
-
188
-
189
-
190
-
191
-
192
-
193
-
194
-
195
-
196
-
197
-
198
-
199
-
200
-
201
-
202
-
203
-
204
-
205
-
206
-
207
-
208
-
209
-
210
-
211
-
212
-
213
-
214
-
215
-
216
-
217
-
218
-
219
-
220
-
221
-
222
-
223
-
224
-
225
-
226
-
227
-
228
-
229
-
230
-
231
-
232
-
233
-
234
-
235
-
236
-
237
-
238
-
239
-
240
-
241
-
242
-
243
-
244
-
245
-
246
-
247
-
248
-
249
-
250
-
251
-
252
-
253
-
254
-
255
-
256
-
257
-
258
-
259
-
260
-
261
-
262
-
263
-
264
-
265
-
266
-
267
-
268
-
269
-
270
-
271
-
272
-
273
-
274
-
275
-
276
-
277
-
278
-
279
-
280
-
281
-
282
-
283
-
284
-
285
-
286
-
287
-
288
-
289
-
290
-
291
-
292
-
293
-
294
-
295
-
296
-
297
-
298
-
299
-
300
-
301
-
302
-
303
-
304
-
305
-
306
-
307
-
308
-
309
-
310
-
311
-
312
-
313
-
314
-
315
-
316
-
317
-
318
-
319
-
320
-
321
-
322
-
323
-
324
-
325
-
326
-
327
-
328
-
329
-
330
-
331
-
332
-
333
-
334
-
335
-
336
-
337
-
338
-
339
-
340
-
341
-
342
 |
 |

92
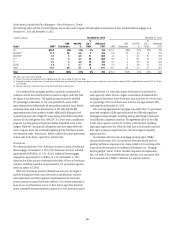
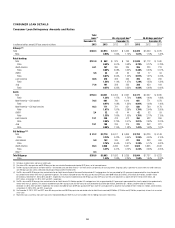
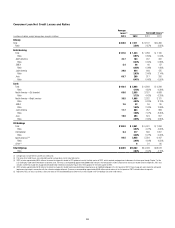
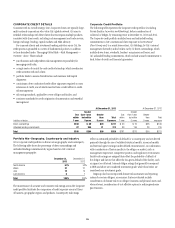
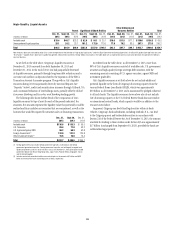
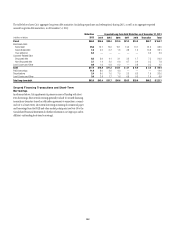
CONSUMER LOAN DETAILS
Consumer Loan Delinquency Amounts and Ratios
Total
loans (1) 90+ days past due (2) 30-89 days past due (2)
December 31, December 31, December 31,
In millions of dollars, except EOP loan amounts in billions 2013 2013 2012 2011 2013 2012 2011
Citicorp (3)(4)
Total $ 302.3 $ 2,973 $ 3,081 $ 3,406 $3,220 $ 3,509 $ 4,075
Ratio 0.99% 1.05% 1.19% 1.07% 1.19% 1.42%
Retail banking
Total $ 151.9 $ 952 $ 879 $ 769 $ 1,049 $ 1,112 $ 1,040
Ratio 0.63% 0.61% 0.58% 0.70% 0.77% 0.78%
North America 44.1 257 280 235 205 223 213
Ratio 0.60% 0.68% 0.63% 0.48% 0.54% 0.57%
EMEA 5.6 34 48 59 51 77 94
Ratio 0.61% 0.94% 1.40% 0.91% 1.51% 2.24%
Latin America 30.6 470 323 253 395 353 289
Ratio 1.54% 1.14% 1.07% 1.29% 1.25% 1.22%
Asia 71.6 191 228 222 398 459 444
Ratio 0.27% 0.33% 0.33% 0.56% 0.66% 0.66%
Cards
Total $ 150.4 $ 2,021 $ 2,202 $ 2,637 $2,171 $ 2,397 $ 3,035
Ratio 1.34% 1.47% 1.72% 1.44% 1.60% 1.98%
North America—Citi-branded 70.5 681 786 1,016 661 771 1,078
Ratio 0.97% 1.08% 1.32% 0.94% 1.06% 1.40%
North America—Citi retail services 46.3 771 721 951 830 789 1,178
Ratio 1.67% 1.87% 2.38% 1.79% 2.04% 2.95%
EMEA 2.4 32 48 44 42 63 59
Ratio 1.33% 1.66% 1.63% 1.75% 2.17% 2.19%
Latin America 12.1 349 413 412 364 432 399
Ratio 2.88% 2.79% 3.01% 3.01% 2.92% 2.91%
Asia 19.1 188 234 214 274 342 321
Ratio 0.98% 1.15% 1.08% 1.43% 1.68% 1.61%
Citi Holdings (5)(6)
Total $ 91.2 $ 2,710 $ 4,611 $ 5,849 $2,724 $ 4,228 $ 5,148
Ratio 3.23% 4.42% 4.66% 3.25% 4.05% 4.10%
International 5.9 162 345 422 200 393 499
Ratio 2.75% 4.54% 3.91% 3.39% 5.17% 4.62%
North America 85.3 2,548 4,266 5,427 2,524 3,835 4,649
Ratio 3.27% 4.41% 4.73% 3.24% 3.96% 4.05%
Other (7) 0.3
Total Citigroup $393.8 $ 5,683 $ 7,692 $ 9,255 $5,944 $ 7,737 $ 9,223
Ratio 1.48% 1.93% 2.25% 1.54% 1.94% 2.24%
(1) Total loans include interest and fees on credit cards.
(2) The ratios of 90+ days past due and 30-89 days past due are calculated based on end-of-period (EOP) loans, net of unearned income.
(3) The 90+ days past due balances for North America—Citi-branded cards and North America—Citi retail services are generally still accruing interest. Citigroup’s policy is generally to accrue interest on credit card loans
until 180 days past due, unless notification of bankruptcy filing has been received earlier.
(4) The 90+ days and 30-89 days past due and related ratios for North America Regional Consumer Banking exclude U.S. mortgage loans that are guaranteed by U.S. government-sponsored entities since the potential
loss predominantly resides within the U.S. government agencies. The amounts excluded for loans 90+ days past due and (EOP loans) were $690 million ($1.2 billion), $742 million ($1.4 billion), and $611 million
($1.3 billion) at December 31, 2013, 2012 and 2011, respectively. The amounts excluded for loans 30-89 days past due (EOP loans have the same adjustment as above) were $141 million, $122 million, and
$121 million, at December 31, 2013, 2012 and 2011, respectively.
(5) The 90+ days and 30-89 days past due and related ratios for North America Citi Holdings exclude U.S. mortgage loans that are guaranteed by U.S. government-sponsored entities since the potential loss predominantly
resides within the U.S. agencies. The amounts excluded for loans 90+ days past due (and EOP loans) for each period were $3.3 billion ($6.4 billion), $4.0 billion ($7.1 billion), and $4.4 billion ($7.9 billion) at
December 31, 2013, 2012 and 2011, respectively. The amounts excluded for loans 30-89 days past due (EOP loans have the same adjustment as above) for each period were $1.1 billion, $1.2 billion, and $1.5 billion,
at December 31, 2013, 2012 and 2011, respectively.
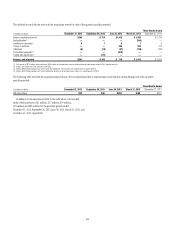
(6) The December 31, 2013, 2012 and 2011 loans 90+ days past due and 30-89 days past due and related ratios for North America exclude $0.9 billion, $1.2 billion and $1.3 billion, respectively, of loans that are carried
at fair value.
(7) Represents loans classified as Consumer loans on the Consolidated Balance Sheet that are not included in the Citi Holdings Consumer credit metrics.