Citibank 2013 Annual Report Download - page 249
Download and view the complete annual report
Please find page 249 of the 2013 Citibank annual report below. You can navigate through the pages in the report by either clicking on the pages listed below, or by using the keyword search tool below to find specific information within the annual report.-
 1
1 -
2
-
3
-
4
-
5
-
6
-
7
-
8
-
9
-
10
-
11
-
12
-
13
-
14
-
15
-
16
-
17
-
18
-
19
-
20
-
21
-
22
-
23
-
24
-
25
-
26
-
27
-
28
-
29
-
30
-
31
-
32
-
33
-
34
-
35
-
36
-
37
-
38
-
39
-
40
-
41
-
42
-
43
-
44
-
45
-
46
-
47
-
48
-
49
-
50
-
51
-
52
-
53
-
54
-
55
-
56
-
57
-
58
-
59
-
60
-
61
-
62
-
63
-
64
-
65
-
66
-
67
-
68
-
69
-
70
-
71
-
72
-
73
-
74
-
75
-
76
-
77
-
78
-
79
-
80
-
81
-
82
-
83
-
84
-
85
-
86
-
87
-
88
-
89
-
90
-
91
-
92
-
93
-
94
-
95
-
96
-
97
-
98
-
99
-
100
-
101
-
102
-
103
-
104
-
105
-
106
-
107
-
108
-
109
-
110
-
111
-
112
-
113
-
114
-
115
-
116
-
117
-
118
-
119
-
120
-
121
-
122
-
123
-
124
-
125
-
126
-
127
-
128
-
129
-
130
-
131
-
132
-
133
-
134
-
135
-
136
-
137
-
138
-
139
-
140
-
141
-
142
-
143
-
144
-
145
-
146
-
147
-
148
-
149
-
150
-
151
-
152
-
153
-
154
-
155
-
156
-
157
-
158
-
159
-
160
-
161
-
162
-
163
-
164
-
165
-
166
-
167
-
168
-
169
-
170
-
171
-
172
-
173
-
174
-
175
-
176
-
177
-
178
-
179
-
180
-
181
-
182
-
183
-
184
-
185
-
186
-
187
-
188
-
189
-
190
-
191
-
192
-
193
-
194
-
195
-
196
-
197
-
198
-
199
-
200
-
201
-
202
-
203
-
204
-
205
-
206
-
207
-
208
-
209
-
210
-
211
-
212
-
213
-
214
-
215
-
216
-
217
-
218
-
219
-
220
-
221
-
222
-
223
-
224
-
225
-
226
-
227
-
228
-
229
-
230
-
231
-
232
-
233
-
234
-
235
-
236
-
237
-
238
-
 239
239 -
 240
240 -
 241
241 -
 242
242 -
 243
243 -
 244
244 -
 245
245 -
 246
246 -
 247
247 -
 248
248 -
 249
249 -
 250
250 -
 251
251 -
 252
252 -
 253
253 -
 254
254 -
 255
255 -
 256
256 -
 257
257 -
 258
258 -
 259
259 -
260
-
261
-
262
-
263
-
264
-
265
-
266
-
267
-
268
-
269
-
270
-
271
-
272
-
273
-
274
-
275
-
276
-
277
-
278
-
279
-
280
-
281
-
282
-
283
-
284
-
285
-
286
-
287
-
288
-
289
-
290
-
291
-
292
-
293
-
294
-
295
-
296
-
297
-
298
-
299
-
300
-
301
-
302
-
303
-
304
-
305
-
306
-
307
-
308
-
309
-
310
-
311
-
312
-
313
-
314
-
315
-
316
-
317
-
318
-
319
-
320
-
321
-
322
-
323
-
324
-
325
-
326
-
327
-
328
-
329
-
330
-
331
-
332
-
333
-
334
-
335
-
336
-
337
-
338
-
339
-
340
-
341
-
342
 |
 |
231
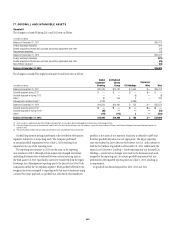
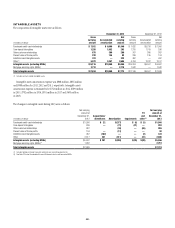
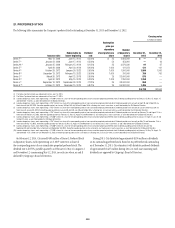
INTANGIBLE ASSETS
The components of intangible assets were as follows:
December 31, 2013 December 31, 2012
In millions of dollars
Gross
carrying
amount
Accumulated
amortization
Net
carrying
amount
Gross
carrying
amount
Accumulated
amortization
Net
carrying
amount
Purchased credit card relationships $ 7,552 $ 6,006 $1,546 $ 7,632 $5,726 $1,906
Core deposit intangibles 1,255 1,052 203 1,315 1,019 296
Other customer relationships 675 389 286 767 380 387
Present value of future profits 238 146 92 239 135 104
Indefinite-lived intangible assets 323 — 323 487 — 487
Other (1) 5,073 2,467 2,606 4,764 2,247 2,517
Intangible assets (excluding MSRs) $15,116 $10,060 $5,056 $15,204 $9,507 $5,697
Mortgage servicing rights (MSRs) 2,718 — 2,718 1,942 — 1,942
Total intangible assets $17,834 $10,060 $7,774 $17,146 $9,507 $7,639
(1) Includes contract-related intangible assets.
Intangible assets amortization expense was $808 million, $856 million
and $898 million for 2013, 2012 and 2011, respectively. Intangible assets
amortization expense is estimated to be $743 million in 2014, $699 million
in 2015, $792 million in 2016, $851 million in 2017 and $403 million
in 2018.
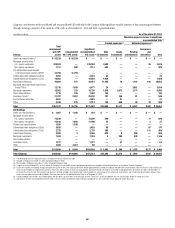
The changes in intangible assets during 2013 were as follows:
In millions of dollars
Net carrying
amount at
December 31,
2012
Acquisitions/
divestitures Amortization Impairments
FX
and
other (1)
Net carrying
amount at
December 31,
2013
Purchased credit card relationships $1,906 $ 22 $(377) $ (4) $ (1) $1,546
Core deposit intangibles 296 — (72) (21) — 203
Other customer relationships 387 (36) — (65) 286
Present value of future profits 104 — (12) — — 92
Indefinite-lived intangible assets 487 (162) — — (2) 323
Other 2,517 431 (311) — (31) 2,606
Intangible assets (excluding MSRs) $5,697 $ 291 $(808) $(25) $(99) $5,056
Mortgage servicing rights (MSRs) (2) 1,942 2,718
Total intangible assets $7,639 $7,774
(1) Includes foreign exchange translation and purchase accounting adjustments.
(2) See Note 22 to the Consolidated Financial Statements for the roll-forward of MSRs.