Citibank 2013 Annual Report Download - page 63
Download and view the complete annual report
Please find page 63 of the 2013 Citibank annual report below. You can navigate through the pages in the report by either clicking on the pages listed below, or by using the keyword search tool below to find specific information within the annual report.-
 1
1 -
2
-
3
-
4
-
5
-
6
-
7
-
8
-
9
-
10
-
11
-
12
-
13
-
14
-
15
-
16
-
17
-
18
-
19
-
20
-
21
-
22
-
23
-
24
-
25
-
26
-
27
-
28
-
29
-
30
-
31
-
32
-
33
-
34
-
35
-
36
-
37
-
38
-
39
-
40
-
41
-
42
-
43
-
44
-
45
-
46
-
47
-
48
-
49
-
50
-
51
-
52
-
 53
53 -
 54
54 -
 55
55 -
 56
56 -
 57
57 -
 58
58 -
 59
59 -
 60
60 -
 61
61 -
 62
62 -
 63
63 -
 64
64 -
 65
65 -
 66
66 -
 67
67 -
 68
68 -
 69
69 -
 70
70 -
 71
71 -
 72
72 -
 73
73 -
74
-
75
-
76
-
77
-
78
-
79
-
80
-
81
-
82
-
83
-
84
-
85
-
86
-
87
-
88
-
89
-
90
-
91
-
92
-
93
-
94
-
95
-
96
-
97
-
98
-
99
-
100
-
101
-
102
-
103
-
104
-
105
-
106
-
107
-
108
-
109
-
110
-
111
-
112
-
113
-
114
-
115
-
116
-
117
-
118
-
119
-
120
-
121
-
122
-
123
-
124
-
125
-
126
-
127
-
128
-
129
-
130
-
131
-
132
-
133
-
134
-
135
-
136
-
137
-
138
-
139
-
140
-
141
-
142
-
143
-
144
-
145
-
146
-
147
-
148
-
149
-
150
-
151
-
152
-
153
-
154
-
155
-
156
-
157
-
158
-
159
-
160
-
161
-
162
-
163
-
164
-
165
-
166
-
167
-
168
-
169
-
170
-
171
-
172
-
173
-
174
-
175
-
176
-
177
-
178
-
179
-
180
-
181
-
182
-
183
-
184
-
185
-
186
-
187
-
188
-
189
-
190
-
191
-
192
-
193
-
194
-
195
-
196
-
197
-
198
-
199
-
200
-
201
-
202
-
203
-
204
-
205
-
206
-
207
-
208
-
209
-
210
-
211
-
212
-
213
-
214
-
215
-
216
-
217
-
218
-
219
-
220
-
221
-
222
-
223
-
224
-
225
-
226
-
227
-
228
-
229
-
230
-
231
-
232
-
233
-
234
-
235
-
236
-
237
-
238
-
239
-
240
-
241
-
242
-
243
-
244
-
245
-
246
-
247
-
248
-
249
-
250
-
251
-
252
-
253
-
254
-
255
-
256
-
257
-
258
-
259
-
260
-
261
-
262
-
263
-
264
-
265
-
266
-
267
-
268
-
269
-
270
-
271
-
272
-
273
-
274
-
275
-
276
-
277
-
278
-
279
-
280
-
281
-
282
-
283
-
284
-
285
-
286
-
287
-
288
-
289
-
290
-
291
-
292
-
293
-
294
-
295
-
296
-
297
-
298
-
299
-
300
-
301
-
302
-
303
-
304
-
305
-
306
-
307
-
308
-
309
-
310
-
311
-
312
-
313
-
314
-
315
-
316
-
317
-
318
-
319
-
320
-
321
-
322
-
323
-
324
-
325
-
326
-
327
-
328
-
329
-
330
-
331
-
332
-
333
-
334
-
335
-
336
-
337
-
338
-
339
-
340
-
341
-
342
 |
 |

45
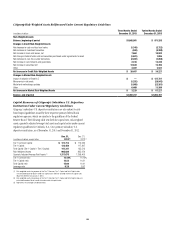
Citigroup Capital Rollforward Under Current Regulatory Guidelines
In millions of dollars
Three Months Ended
December 31, 2013
Twelve Months Ended
December 31, 2013
Tier 1 Common Capital
Balance, beginning of period $135,540 $123,095
Net income 2,456 13,673
Dividends declared (100) (314)
Net increase in treasury stock (186) (811)
Net increase in additional paid-in capital (1)(2) 197 895
Net decrease in foreign currency translation adjustment included in accumulated
other comprehensive income, net of tax (391) (2,245)
Net decrease in cumulative effect included in fair value of financial liabilities attributable
to the change in own creditworthiness, net of tax 86 242
Net decrease in disallowed deferred tax assets 426 2,416
Net decrease in goodwill and other disallowed intangible assets, net of related DTL 65 1,051
Net increase in net unrealized losses on AFS equity securities, net of tax (66) (66)
Other 43 134
Net increase in Tier 1 Common Capital $ 2,530 $ 14,975
Balance, end of period $138,070 $138,070
Tier 1 Capital
Balance, beginning of period $145,791 $136,532
Net increase in Tier 1 Common Capital 2,530 14,975
Net decrease in qualifying trust preferred securities (363) (6,125)
Net increase in qualifying perpetual preferred stock (2) 1,461 4,083
Net change in qualifying noncontrolling interests 25 (21)
Net increase in Tier 1 Capital $ 3,653 $ 12,912
Balance, end of period $149,444 $149,444
Tier 2 Capital
Balance, beginning of period $ 32,550 $ 31,154
Net increase in allowance for credit losses eligible for inclusion in Tier 2 Capital (3) 277 1,426
Net change in qualifying subordinated debt (312) 69
Net decrease in net unrealized pretax gains on AFS equity securities
eligible for inclusion in Tier 2 Capital (1) (135)
Net change in Tier 2 Capital $ (36) $ 1,360
Balance, end of period $ 32,514 $ 32,514
Total Capital (Tier 1 Capital + Tier 2 Capital) $181,958 $181,958
(1) Primarily represents an increase in additional paid-in capital related to employee benefit plans.
(2) Citi issued approximately $1.5 billion and approximately $4.3 billion of qualifying perpetual preferred stock during the three months and twelve months ended December 31, 2013, respectively. These issuances were
partially offset by both redemptions and the netting of issuance costs, which in the aggregate were $34 million and $187 million for the three months and twelve months ended December 31, 2013, respectively. For
U.S. GAAP purposes, issuance costs of $34 million and $93 million for the three months and twelve months ended December 31, 2013, respectively, were netted against additional paid-in capital.
(3) The net increase for the year ended December 31, 2013 reflects, in part, an increase in the portion of the allowance for credit losses eligible for inclusion in Tier 2 Capital resulting from an increase in gross risk-
weighted assets due to the adoption of Basel II.5.