Citibank 2013 Annual Report Download - page 114
Download and view the complete annual report
Please find page 114 of the 2013 Citibank annual report below. You can navigate through the pages in the report by either clicking on the pages listed below, or by using the keyword search tool below to find specific information within the annual report.-
 1
1 -
2
-
3
-
4
-
5
-
6
-
7
-
8
-
9
-
10
-
11
-
12
-
13
-
14
-
15
-
16
-
17
-
18
-
19
-
20
-
21
-
22
-
23
-
24
-
25
-
26
-
27
-
28
-
29
-
30
-
31
-
32
-
33
-
34
-
35
-
36
-
37
-
38
-
39
-
40
-
41
-
42
-
43
-
44
-
45
-
46
-
47
-
48
-
49
-
50
-
51
-
52
-
53
-
54
-
55
-
56
-
57
-
58
-
59
-
60
-
61
-
62
-
63
-
64
-
65
-
66
-
67
-
68
-
69
-
70
-
71
-
72
-
73
-
74
-
75
-
76
-
77
-
78
-
79
-
80
-
81
-
82
-
83
-
84
-
85
-
86
-
87
-
88
-
89
-
90
-
91
-
92
-
93
-
94
-
95
-
96
-
97
-
98
-
99
-
100
-
101
-
102
-
103
-
 104
104 -
 105
105 -
 106
106 -
 107
107 -
 108
108 -
 109
109 -
 110
110 -
 111
111 -
 112
112 -
 113
113 -
 114
114 -
 115
115 -
 116
116 -
 117
117 -
 118
118 -
 119
119 -
 120
120 -
 121
121 -
 122
122 -
 123
123 -
 124
124 -
125
-
126
-
127
-
128
-
129
-
130
-
131
-
132
-
133
-
134
-
135
-
136
-
137
-
138
-
139
-
140
-
141
-
142
-
143
-
144
-
145
-
146
-
147
-
148
-
149
-
150
-
151
-
152
-
153
-
154
-
155
-
156
-
157
-
158
-
159
-
160
-
161
-
162
-
163
-
164
-
165
-
166
-
167
-
168
-
169
-
170
-
171
-
172
-
173
-
174
-
175
-
176
-
177
-
178
-
179
-
180
-
181
-
182
-
183
-
184
-
185
-
186
-
187
-
188
-
189
-
190
-
191
-
192
-
193
-
194
-
195
-
196
-
197
-
198
-
199
-
200
-
201
-
202
-
203
-
204
-
205
-
206
-
207
-
208
-
209
-
210
-
211
-
212
-
213
-
214
-
215
-
216
-
217
-
218
-
219
-
220
-
221
-
222
-
223
-
224
-
225
-
226
-
227
-
228
-
229
-
230
-
231
-
232
-
233
-
234
-
235
-
236
-
237
-
238
-
239
-
240
-
241
-
242
-
243
-
244
-
245
-
246
-
247
-
248
-
249
-
250
-
251
-
252
-
253
-
254
-
255
-
256
-
257
-
258
-
259
-
260
-
261
-
262
-
263
-
264
-
265
-
266
-
267
-
268
-
269
-
270
-
271
-
272
-
273
-
274
-
275
-
276
-
277
-
278
-
279
-
280
-
281
-
282
-
283
-
284
-
285
-
286
-
287
-
288
-
289
-
290
-
291
-
292
-
293
-
294
-
295
-
296
-
297
-
298
-
299
-
300
-
301
-
302
-
303
-
304
-
305
-
306
-
307
-
308
-
309
-
310
-
311
-
312
-
313
-
314
-
315
-
316
-
317
-
318
-
319
-
320
-
321
-
322
-
323
-
324
-
325
-
326
-
327
-
328
-
329
-
330
-
331
-
332
-
333
-
334
-
335
-
336
-
337
-
338
-
339
-
340
-
341
-
342
 |
 |

96
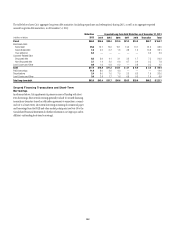
The following table presents the Corporate credit portfolio by facility risk
rating at December 31, 2013 and December 31, 2012, as a percentage of the
total Corporate credit portfolio:
Direct outstandings and
unfunded lending commitments
December 31,
2013
December 31,
2012
AAA/AA/A 52% 52%
BBB 16 14
BB/B 30 32
CCC or below 22
Unrated ——
Total 100% 100%
Citi’s Corporate credit portfolio is also diversified by industry, with a
concentration in the financial sector, broadly defined, and including banks,
other financial institutions, insurance companies, investment banks and
government and central banks. The following table shows the allocation of
direct outstandings and unfunded lending commitments to industries as a
percentage of the total Corporate credit portfolio:
Direct outstandings and
unfunded lending commitments
December 31,
2013
December 31,
2012
Transportation and industrial 22% 21%
Petroleum, energy, chemical and metal 20 20
Consumer retail and health 15 15
Banks/broker-dealers 10 10
Technology, media and telecom 10 9
Public sector 68
Insurance and special purpose entities 56
Real estate 54
Hedge funds 44
Other industries 33
Total 100% 100%
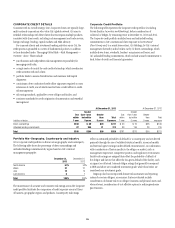
Credit Risk Mitigation
As part of its overall risk management activities, Citigroup uses credit
derivatives and other risk mitigants to hedge portions of the credit risk in its
Corporate credit portfolio, in addition to outright asset sales. The purpose
of these transactions is to transfer credit risk to third parties. The results of
the mark-to-market and any realized gains or losses on credit derivatives
are reflected in Principal transactions on the Consolidated Statement of
Income.
At December 31, 2013 and December 31, 2012, $27.2 billion and
$33.0 billion, respectively, of the Corporate credit portfolio was economically
hedged. Citigroup’s expected loss model used in the calculation of its loan
loss reserve does not include the favorable impact of credit derivatives
and other mitigants that are marked to market. In addition, the reported
amounts of direct outstandings and unfunded lending commitments in
the tables above do not reflect the impact of these hedging transactions.
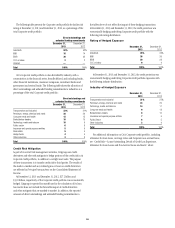
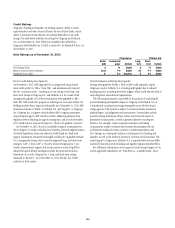
At December 31, 2013 and December 31, 2012, the credit protection was
economically hedging underlying Corporate credit portfolio with the
following risk rating distribution:
Rating of Hedged Exposure
December 31,
2013
December 31,
2012
AAA/AA/A 26% 34%
BBB 36 39
BB/B 29 23
CCC or below 94
Total 100% 100%
At December 31, 2013 and December 31, 2012, the credit protection was
economically hedging underlying Corporate credit portfolio exposures with
the following industry distribution:
Industry of Hedged Exposure
December 31,
2013
December 31,
2012
Transportation and industrial 31% 27%
Petroleum, energy, chemical and metal 23 25
Technology, media and telecom 14 11
Consumer retail and health 913
Banks/broker-dealers 810
Insurance and special purpose entities 75
Public Sector 65
Other industries 24
Total 100% 100%
For additional information on Citi’s Corporate credit portfolio, including
allowance for loan losses, coverage ratios and Corporate non-accrual loans,
see “Credit Risk—Loans Outstanding, Details of Credit Loss Experience,
Allowance for Loan Losses and Non-Accrual Loans and Assets” above.