Citibank 2013 Annual Report Download - page 144
Download and view the complete annual report
Please find page 144 of the 2013 Citibank annual report below. You can navigate through the pages in the report by either clicking on the pages listed below, or by using the keyword search tool below to find specific information within the annual report.-
 1
1 -
2
-
3
-
4
-
5
-
6
-
7
-
8
-
9
-
10
-
11
-
12
-
13
-
14
-
15
-
16
-
17
-
18
-
19
-
20
-
21
-
22
-
23
-
24
-
25
-
26
-
27
-
28
-
29
-
30
-
31
-
32
-
33
-
34
-
35
-
36
-
37
-
38
-
39
-
40
-
41
-
42
-
43
-
44
-
45
-
46
-
47
-
48
-
49
-
50
-
51
-
52
-
53
-
54
-
55
-
56
-
57
-
58
-
59
-
60
-
61
-
62
-
63
-
64
-
65
-
66
-
67
-
68
-
69
-
70
-
71
-
72
-
73
-
74
-
75
-
76
-
77
-
78
-
79
-
80
-
81
-
82
-
83
-
84
-
85
-
86
-
87
-
88
-
89
-
90
-
91
-
92
-
93
-
94
-
95
-
96
-
97
-
98
-
99
-
100
-
101
-
102
-
103
-
104
-
105
-
106
-
107
-
108
-
109
-
110
-
111
-
112
-
113
-
114
-
115
-
116
-
117
-
118
-
119
-
120
-
121
-
122
-
123
-
124
-
125
-
126
-
127
-
128
-
129
-
130
-
131
-
132
-
133
-
 134
134 -
 135
135 -
 136
136 -
 137
137 -
 138
138 -
 139
139 -
 140
140 -
 141
141 -
 142
142 -
 143
143 -
 144
144 -
 145
145 -
 146
146 -
 147
147 -
 148
148 -
 149
149 -
 150
150 -
 151
151 -
 152
152 -
 153
153 -
 154
154 -
155
-
156
-
157
-
158
-
159
-
160
-
161
-
162
-
163
-
164
-
165
-
166
-
167
-
168
-
169
-
170
-
171
-
172
-
173
-
174
-
175
-
176
-
177
-
178
-
179
-
180
-
181
-
182
-
183
-
184
-
185
-
186
-
187
-
188
-
189
-
190
-
191
-
192
-
193
-
194
-
195
-
196
-
197
-
198
-
199
-
200
-
201
-
202
-
203
-
204
-
205
-
206
-
207
-
208
-
209
-
210
-
211
-
212
-
213
-
214
-
215
-
216
-
217
-
218
-
219
-
220
-
221
-
222
-
223
-
224
-
225
-
226
-
227
-
228
-
229
-
230
-
231
-
232
-
233
-
234
-
235
-
236
-
237
-
238
-
239
-
240
-
241
-
242
-
243
-
244
-
245
-
246
-
247
-
248
-
249
-
250
-
251
-
252
-
253
-
254
-
255
-
256
-
257
-
258
-
259
-
260
-
261
-
262
-
263
-
264
-
265
-
266
-
267
-
268
-
269
-
270
-
271
-
272
-
273
-
274
-
275
-
276
-
277
-
278
-
279
-
280
-
281
-
282
-
283
-
284
-
285
-
286
-
287
-
288
-
289
-
290
-
291
-
292
-
293
-
294
-
295
-
296
-
297
-
298
-
299
-
300
-
301
-
302
-
303
-
304
-
305
-
306
-
307
-
308
-
309
-
310
-
311
-
312
-
313
-
314
-
315
-
316
-
317
-
318
-
319
-
320
-
321
-
322
-
323
-
324
-
325
-
326
-
327
-
328
-
329
-
330
-
331
-
332
-
333
-
334
-
335
-
336
-
337
-
338
-
339
-
340
-
341
-
342
 |
 |

126
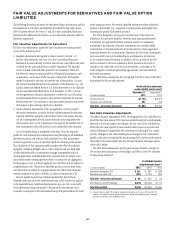
WhenCitipurchasesCDSasahedgeagainstacreditexposure,itgenerally
seeks to purchase products from counterparties that would not be correlated
with the underlying credit exposure it is hedging. In addition, Citi generally
seeks to purchase products with a maturity date similar to the exposure
against which the protection is purchased. While certain exposures may have
longermaturitiesthatextendbeyondtheCDStenorsreadilyavailableinthe
market, Citi generally will purchase credit protection with a maximum tenor
that is readily available in the market.
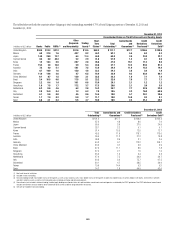
TheabovetablecontainsallnetCDSpurchasedorsoldonunderlying
GIIPSsinglereferenceentities,whetherpartofatradingstrategyoras
purchased credit protection. With respect to the $15.5 billion net purchased
CDScontractsonunderlyingGIIPSreferenceentitiesatDecember31,2013
(comparedto$14.0billionatSeptember30,2013),approximately94%was
purchasedfromnon-GIIPScounterpartiesand90%waspurchasedfrom
investment grade counterparties.
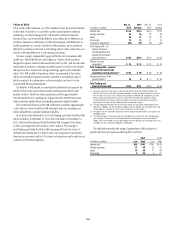
Secured Financing Transactions
As part of its banking activities with its clients, Citi enters into secured
financing transactions, such as repurchase agreements and reverse
repurchase agreements. These transactions typically involve the lending of
cash, against which securities are taken as collateral. The amount of cash
loaned against the securities collateral is a function of the liquidity and
quality of the collateral as well as the credit quality of the counterparty. The
collateral is typically marked to market daily, and Citi has the ability to call
for additional collateral (usually in the form of cash) if the value of the
securities falls below a pre-defined threshold.
As shown in the table below, at December 31, 2013, Citi had loaned
$14.4billionincashthroughsecuredfinancingtransactionswithGIIPS
counterparties, usually through reverse repurchase agreements (compared
to$11.7billionasofSeptember30,2013).Againstthoseloans,itheld
approximately $16.7 billion fair value of securities collateral (compared to
$13.7billionasofSeptember30,2013).Inaddition,Citiheld$0.1billionin
variationmargin(unchangedfromSeptember30,2013),mostofwhichwas
in cash, against all secured financing transactions.
Consistent with Citi’s risk management systems, secured financing
transactions are included in the counterparty derivative mark-to-market
exposure at their net credit exposure value, which is typically small or zero
given the over-collateralized structure of these transactions.
In billions of dollars
as of December 31, 2013 Cash financing out Securities collateral in (1)
Lending to GIIPS counterparties
through secured financing
transactions $14.4 $16.7
(1) Citi has also received approximately $0.1 billion in variation margin, predominantly cash, associated
with secured financing transactions with these counterparties.
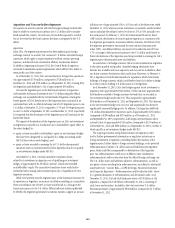
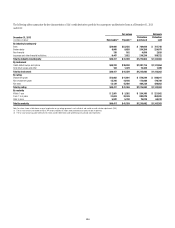
Collateral taken in against secured financing transactions is generally
high quality, marketable securities, consisting of government debt, corporate
debt, or asset-backed securities. The table below sets forth the fair value of the
securities collateral taken in by Citi against secured financing transactions as
of December 31, 2013.
In billions of dollars
as of December 31, 2013 Total
Government
bonds
Municipal or
Corporate
bonds
Asset-backed
bonds
Securities pledged by GIIPS
counterparties in secured
financing transaction
lending (1) $16.7 $8.6 $0.8 $ 7.3
Investment grade $16.4 $8.6 $0.6 $ 7.3
Non-investment grade 0.1 — 0.1 —
Not rated 0.2 — 0.2 —
(1) Total includes approximately $1.5 billion in correlated risk collateral.
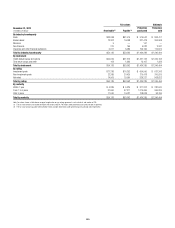
Securedfinancingtransactionscanbeshorttermorcanextendbeyond
one year. In most cases, Citi has the right to call for additional margin
daily, and can terminate the transaction and liquidate the collateral if
the counterparty fails to post the additional margin. The table below
sets forth the remaining transaction tenor for these transactions as of
December 31, 2013.
Remaining transaction tenor
In billions of dollars
as of December 31, 2013 Total <1 year 1-3 years >3 years
Cash extended to GIIPS counterparties
in secured financing transactions
lending (1) $14.4 $7.8 $1.9 $4.6
(1) The longest remaining tenor trades mature November 2018.