Citibank 2013 Annual Report Download - page 236
Download and view the complete annual report
Please find page 236 of the 2013 Citibank annual report below. You can navigate through the pages in the report by either clicking on the pages listed below, or by using the keyword search tool below to find specific information within the annual report.-
 1
1 -
2
-
3
-
4
-
5
-
6
-
7
-
8
-
9
-
10
-
11
-
12
-
13
-
14
-
15
-
16
-
17
-
18
-
19
-
20
-
21
-
22
-
23
-
24
-
25
-
26
-
27
-
28
-
29
-
30
-
31
-
32
-
33
-
34
-
35
-
36
-
37
-
38
-
39
-
40
-
41
-
42
-
43
-
44
-
45
-
46
-
47
-
48
-
49
-
50
-
51
-
52
-
53
-
54
-
55
-
56
-
57
-
58
-
59
-
60
-
61
-
62
-
63
-
64
-
65
-
66
-
67
-
68
-
69
-
70
-
71
-
72
-
73
-
74
-
75
-
76
-
77
-
78
-
79
-
80
-
81
-
82
-
83
-
84
-
85
-
86
-
87
-
88
-
89
-
90
-
91
-
92
-
93
-
94
-
95
-
96
-
97
-
98
-
99
-
100
-
101
-
102
-
103
-
104
-
105
-
106
-
107
-
108
-
109
-
110
-
111
-
112
-
113
-
114
-
115
-
116
-
117
-
118
-
119
-
120
-
121
-
122
-
123
-
124
-
125
-
126
-
127
-
128
-
129
-
130
-
131
-
132
-
133
-
134
-
135
-
136
-
137
-
138
-
139
-
140
-
141
-
142
-
143
-
144
-
145
-
146
-
147
-
148
-
149
-
150
-
151
-
152
-
153
-
154
-
155
-
156
-
157
-
158
-
159
-
160
-
161
-
162
-
163
-
164
-
165
-
166
-
167
-
168
-
169
-
170
-
171
-
172
-
173
-
174
-
175
-
176
-
177
-
178
-
179
-
180
-
181
-
182
-
183
-
184
-
185
-
186
-
187
-
188
-
189
-
190
-
191
-
192
-
193
-
194
-
195
-
196
-
197
-
198
-
199
-
200
-
201
-
202
-
203
-
204
-
205
-
206
-
207
-
208
-
209
-
210
-
211
-
212
-
213
-
214
-
215
-
216
-
217
-
218
-
219
-
220
-
221
-
222
-
223
-
224
-
225
-
 226
226 -
 227
227 -
 228
228 -
 229
229 -
 230
230 -
 231
231 -
 232
232 -
 233
233 -
 234
234 -
 235
235 -
 236
236 -
 237
237 -
 238
238 -
 239
239 -
 240
240 -
 241
241 -
 242
242 -
 243
243 -
 244
244 -
 245
245 -
 246
246 -
247
-
248
-
249
-
250
-
251
-
252
-
253
-
254
-
255
-
256
-
257
-
258
-
259
-
260
-
261
-
262
-
263
-
264
-
265
-
266
-
267
-
268
-
269
-
270
-
271
-
272
-
273
-
274
-
275
-
276
-
277
-
278
-
279
-
280
-
281
-
282
-
283
-
284
-
285
-
286
-
287
-
288
-
289
-
290
-
291
-
292
-
293
-
294
-
295
-
296
-
297
-
298
-
299
-
300
-
301
-
302
-
303
-
304
-
305
-
306
-
307
-
308
-
309
-
310
-
311
-
312
-
313
-
314
-
315
-
316
-
317
-
318
-
319
-
320
-
321
-
322
-
323
-
324
-
325
-
326
-
327
-
328
-
329
-
330
-
331
-
332
-
333
-
334
-
335
-
336
-
337
-
338
-
339
-
340
-
341
-
342
 |
 |

218
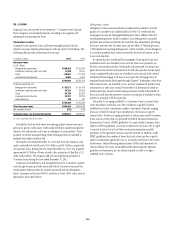
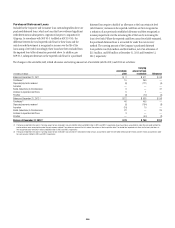
As a result of OCC guidance issued in the third quarter of 2012, mortgage
loans to borrowers that have gone through Chapter 7 bankruptcy are
classified as troubled debt restructurings (TDRs). These TDRs, other than
FHA-insured loans, are written down to collateral value less cost to sell. FHA-
insured loans are reserved based on a discounted cash flow model (see Note
1 to the Consolidated Financial Statements). The recorded investment in
receivables reclassified to TDRs in the third quarter of 2012 as a result of this
OCC guidance approximated $1,714 million, composed of $1,327 million of
residential first mortgages and $387 million of home equity loans.
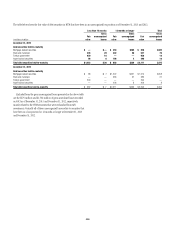
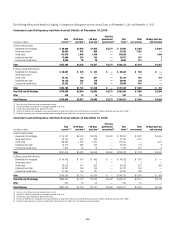
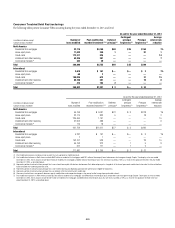
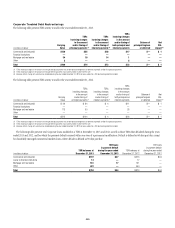
The following tables present information about total impaired Consumer
loans at and for the years ending December 31, 2013 and 2012, respectively:
Impaired Consumer Loans
At and for the year ended December 31, 2013
In millions of dollars
Recorded
investment (1)(2)
Unpaid
principal balance
Related specific
allowance (3)
Average
carrying value (4)
Interest income
recognized (5)(6)
Mortgage and real estate
Residential first mortgages $16,801 $17,788 $2,309 $17,616 $ 790
Home equity loans 2,141 2,806 427 2,116 81
Credit cards 3,339 3,385 1,178 3,720 234
Installment and other
Individual installment and other 1,114 1,143 536 1,094 153
Commercial market loans 398 605 183 404 22
Total (7) $23,793 $25,727 $ 4,633 $24,950 $ 1,280
(1) Recorded investment in a loan includes net deferred loan fees and costs, unamortized premium or discount and direct write-downs and includes accrued interest only on credit card loans.
(2) $2,169 million of residential first mortgages, $568 million of home equity loans and $111 million of commercial market loans do not have a specific allowance.
(3) Included in the Allowance for loan losses.
(4) Average carrying value represents the average recorded investment ending balance for the last four quarters and does not include the related specific allowance.
(5) Includes amounts recognized on both an accrual and cash basis.
(6) Cash interest receipts on smaller-balance homogeneous loans are generally recorded as revenue. The interest recognition policy for commercial market loans is identical to that for Corporate loans, as described below.
(7) Prior to 2008, the Company’s financial accounting systems did not separately track impaired smaller-balance, homogeneous Consumer loans whose terms were modified due to the borrowers’ financial difficulties
and where it was determined that a concession was granted to the borrower. Smaller-balance Consumer loans modified since January 1, 2008 amounted to $23.4 billion at December 31, 2013. However, information
derived from Citi’s risk management systems indicates that the amounts of outstanding modified loans, including those modified prior to 2008, approximated $24.0 billion at December 31, 2013.
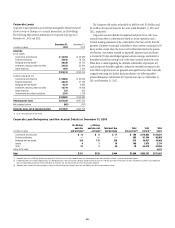
At and for the year ended December 31, 2012
In millions of dollars
Recorded
investment (1)(2)
Unpaid
principal balance
Related specific
allowance (3)
Average
carrying value (4)
Interest income
recognized (5)(6)(7)
Mortgage and real estate
Residential first mortgages $20,870 $22,062 $3,585 $19,956 $ 875
Home equity loans 2,135 2,727 636 1,911 68
Credit cards 4,584 4,639 1,800 5,272 308
Installment and other
Individual installment and other 1,612 1,618 860 1,958 248
Commercial market loans 439 737 60 495 21
Total (8) $29,640 $31,783 $ 6,941 $29,592 $ 1,520
(1) Recorded investment in a loan includes net deferred loan fees and costs, unamortized premium or discount and direct write-downs and includes accrued interest only on credit card loans.
(2) $2,344 million of residential first mortgages, $378 million of home equity loans and $183 million of commercial market loans do not have a specific allowance.
(3) Included in the Allowance for loan losses.
(4) Average carrying value represents the average recorded investment ending balance for last four quarters and does not include related specific allowance.
(5) Includes amounts recognized on both an accrual and cash basis.
(6) Cash interest receipts on smaller-balance homogeneous loans are generally recorded as revenue. The interest recognition policy for commercial market loans is identical to that for Corporate loans, as described below.
(7) Interest income recognized for the year ended December 31, 2011 was $1,711 million.
(8) Prior to 2008, the Company’s financial accounting systems did not separately track impaired smaller-balance, homogeneous Consumer loans whose terms were modified due to the borrowers’ financial difficulties
and where it was determined that a concession was granted to the borrower. Smaller-balance Consumer loans modified since January 1, 2008 amounted to $29.2 billion at December 31, 2012. However, information
derived from Citi’s risk management systems indicates that the amounts of outstanding modified loans, including those modified prior to 2008, approximated $30.1 billion at December 31, 2012.