Citibank 2013 Annual Report Download - page 136
Download and view the complete annual report
Please find page 136 of the 2013 Citibank annual report below. You can navigate through the pages in the report by either clicking on the pages listed below, or by using the keyword search tool below to find specific information within the annual report.-
 1
1 -
2
-
3
-
4
-
5
-
6
-
7
-
8
-
9
-
10
-
11
-
12
-
13
-
14
-
15
-
16
-
17
-
18
-
19
-
20
-
21
-
22
-
23
-
24
-
25
-
26
-
27
-
28
-
29
-
30
-
31
-
32
-
33
-
34
-
35
-
36
-
37
-
38
-
39
-
40
-
41
-
42
-
43
-
44
-
45
-
46
-
47
-
48
-
49
-
50
-
51
-
52
-
53
-
54
-
55
-
56
-
57
-
58
-
59
-
60
-
61
-
62
-
63
-
64
-
65
-
66
-
67
-
68
-
69
-
70
-
71
-
72
-
73
-
74
-
75
-
76
-
77
-
78
-
79
-
80
-
81
-
82
-
83
-
84
-
85
-
86
-
87
-
88
-
89
-
90
-
91
-
92
-
93
-
94
-
95
-
96
-
97
-
98
-
99
-
100
-
101
-
102
-
103
-
104
-
105
-
106
-
107
-
108
-
109
-
110
-
111
-
112
-
113
-
114
-
115
-
116
-
117
-
118
-
119
-
120
-
121
-
122
-
123
-
124
-
125
-
 126
126 -
 127
127 -
 128
128 -
 129
129 -
 130
130 -
 131
131 -
 132
132 -
 133
133 -
 134
134 -
 135
135 -
 136
136 -
 137
137 -
 138
138 -
 139
139 -
 140
140 -
 141
141 -
 142
142 -
 143
143 -
 144
144 -
 145
145 -
 146
146 -
147
-
148
-
149
-
150
-
151
-
152
-
153
-
154
-
155
-
156
-
157
-
158
-
159
-
160
-
161
-
162
-
163
-
164
-
165
-
166
-
167
-
168
-
169
-
170
-
171
-
172
-
173
-
174
-
175
-
176
-
177
-
178
-
179
-
180
-
181
-
182
-
183
-
184
-
185
-
186
-
187
-
188
-
189
-
190
-
191
-
192
-
193
-
194
-
195
-
196
-
197
-
198
-
199
-
200
-
201
-
202
-
203
-
204
-
205
-
206
-
207
-
208
-
209
-
210
-
211
-
212
-
213
-
214
-
215
-
216
-
217
-
218
-
219
-
220
-
221
-
222
-
223
-
224
-
225
-
226
-
227
-
228
-
229
-
230
-
231
-
232
-
233
-
234
-
235
-
236
-
237
-
238
-
239
-
240
-
241
-
242
-
243
-
244
-
245
-
246
-
247
-
248
-
249
-
250
-
251
-
252
-
253
-
254
-
255
-
256
-
257
-
258
-
259
-
260
-
261
-
262
-
263
-
264
-
265
-
266
-
267
-
268
-
269
-
270
-
271
-
272
-
273
-
274
-
275
-
276
-
277
-
278
-
279
-
280
-
281
-
282
-
283
-
284
-
285
-
286
-
287
-
288
-
289
-
290
-
291
-
292
-
293
-
294
-
295
-
296
-
297
-
298
-
299
-
300
-
301
-
302
-
303
-
304
-
305
-
306
-
307
-
308
-
309
-
310
-
311
-
312
-
313
-
314
-
315
-
316
-
317
-
318
-
319
-
320
-
321
-
322
-
323
-
324
-
325
-
326
-
327
-
328
-
329
-
330
-
331
-
332
-
333
-
334
-
335
-
336
-
337
-
338
-
339
-
340
-
341
-
342
 |
 |
118
Regulatory VAR Back-testing
In accordance with Basel II.5, Citi is required to perform back-testing to
evaluate the effectiveness of its VAR model and to determine the capital
multiplier used in the calculation of market risk-weighted-assets. Regulatory
VAR back-testing is the process in which the daily one-day VAR, at a 99%
confidence interval, is compared to the buy-and-hold profit and loss (e.g., the
profit and loss impact if the portfolio is held constant at the end of the day
and re-priced the following day) as required under Basel II.5. Based on a 99%
confidence level, Citi would expect two to three days in any one year where
buy-and-hold losses exceeded the Regulatory VAR. Given the conservative
calibration of Citi’s VAR model (as a result of taking the greater of short- and
long-term volatilities and fat tail scaling of volatilities), Citi would expect fewer
exceptions under normal and stable market conditions. Periods of unstable
market conditions could increase the number of back-testing exceptions.
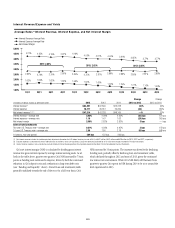
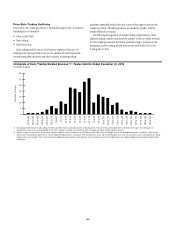
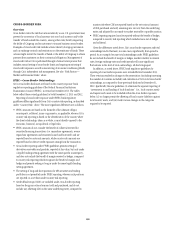
The following graph shows the daily buy-and-hold profit and loss
associated with Citi’s covered positions under Basel II.5 compared to Citi’s
one-day Regulatory VAR during 2013. As the graph indicates, for the twelve
month period ending December 31, 2013, there were no back-testing
exceptions observed for Citi’s Regulatory VAR. Citi posted buy-and-hold gains
in 49% of days where daily Regulatory VAR back-testing was performed.
The difference between the 49% of buy-and-hold gains for Regulatory VAR
back-testing and the 92% of gains shown in the histogram of daily trading
related revenue above reflects, among other things, that a significant portion
of Citi’s trading related revenue is not generated from daily price movements,
on these positions and exposures as well as differences in the portfolio
composition of Regulatory VAR and Risk Management VAR.
Regulatory Trading VAR and Associated Buy-and-Hold Profit and Loss(1) — Twelve Months Ended December 31, 2013
In millions of dollars
-250
-200
-150
-100
-50
0
50
100
150
Buy-and-Hold Profit and Loss
Regulatory Trading VAR
Jan-13 Feb-13 Mar-13 Apr-13 May-13 Jun-13 Jul-13 Aug-13 Sep-13 Oct-13 Nov-13 Dec-13
(1) Buy-and-hold profit and loss, as defined by the banking regulators under Basel II.5, represents the daily mark-to-market revenue movement attributable to the trading position from the close of the previous business
day. Buy-and-hold profit and loss excludes realized trading revenue, net interest, intra-day trading profit and loss on new and terminated trades, as well as changes in reserves. Therefore it is not comparable to the
trading-related revenue presented in the previous histogram of Daily Trading-Related Revenue.
Stress Testing
Citi performs stress testing on a regular basis to estimate the impact of
extreme market movements. It is performed on individual positions and
trading portfolios, as well as in aggregate inclusive of multiple trading
portfolios. Citi’s independent market risk management organization, after
consultations with the businesses, develops both systemic and specific stress
scenarios, reviews the output of periodic stress testing exercises, and uses the
information to assess the ongoing appropriateness of exposure levels and
limits. Citi uses two complementary approaches to market risk stress testing
across all major risk factors (i.e., equity, foreign exchange, commodity,
interest rate and credit spreads): top-down systemic stresses and bottom-
upbusinessspecificstresses.Systemicstressesaredesignedtoquantifythe
potential impact of extreme market movements on a firm-wide basis, and are
constructed using both historical periods of market stress and projections of
adverse economic scenarios. Business specific stresses are designed to probe
the risks of particular portfolios and market segments, especially those risks
that are not fully captured in VaR and systemic stresses.
Factor Sensitivities
Factor sensitivities are expressed as the change in the value of a position for
a defined change in a market risk factor, such as a change in the value of a
Treasury bill for a one-basis-point change in interest rates. Citi’s independent
market risk management ensures that factor sensitivities are calculated,
monitored, and in most cases, limited, for all material risks taken in a
trading portfolio.