Citibank 2013 Annual Report Download - page 105
Download and view the complete annual report
Please find page 105 of the 2013 Citibank annual report below. You can navigate through the pages in the report by either clicking on the pages listed below, or by using the keyword search tool below to find specific information within the annual report.-
 1
1 -
2
-
3
-
4
-
5
-
6
-
7
-
8
-
9
-
10
-
11
-
12
-
13
-
14
-
15
-
16
-
17
-
18
-
19
-
20
-
21
-
22
-
23
-
24
-
25
-
26
-
27
-
28
-
29
-
30
-
31
-
32
-
33
-
34
-
35
-
36
-
37
-
38
-
39
-
40
-
41
-
42
-
43
-
44
-
45
-
46
-
47
-
48
-
49
-
50
-
51
-
52
-
53
-
54
-
55
-
56
-
57
-
58
-
59
-
60
-
61
-
62
-
63
-
64
-
65
-
66
-
67
-
68
-
69
-
70
-
71
-
72
-
73
-
74
-
75
-
76
-
77
-
78
-
79
-
80
-
81
-
82
-
83
-
84
-
85
-
86
-
87
-
88
-
89
-
90
-
91
-
92
-
93
-
94
-
 95
95 -
 96
96 -
 97
97 -
 98
98 -
 99
99 -
 100
100 -
 101
101 -
 102
102 -
 103
103 -
 104
104 -
 105
105 -
 106
106 -
 107
107 -
 108
108 -
 109
109 -
 110
110 -
 111
111 -
 112
112 -
 113
113 -
 114
114 -
 115
115 -
116
-
117
-
118
-
119
-
120
-
121
-
122
-
123
-
124
-
125
-
126
-
127
-
128
-
129
-
130
-
131
-
132
-
133
-
134
-
135
-
136
-
137
-
138
-
139
-
140
-
141
-
142
-
143
-
144
-
145
-
146
-
147
-
148
-
149
-
150
-
151
-
152
-
153
-
154
-
155
-
156
-
157
-
158
-
159
-
160
-
161
-
162
-
163
-
164
-
165
-
166
-
167
-
168
-
169
-
170
-
171
-
172
-
173
-
174
-
175
-
176
-
177
-
178
-
179
-
180
-
181
-
182
-
183
-
184
-
185
-
186
-
187
-
188
-
189
-
190
-
191
-
192
-
193
-
194
-
195
-
196
-
197
-
198
-
199
-
200
-
201
-
202
-
203
-
204
-
205
-
206
-
207
-
208
-
209
-
210
-
211
-
212
-
213
-
214
-
215
-
216
-
217
-
218
-
219
-
220
-
221
-
222
-
223
-
224
-
225
-
226
-
227
-
228
-
229
-
230
-
231
-
232
-
233
-
234
-
235
-
236
-
237
-
238
-
239
-
240
-
241
-
242
-
243
-
244
-
245
-
246
-
247
-
248
-
249
-
250
-
251
-
252
-
253
-
254
-
255
-
256
-
257
-
258
-
259
-
260
-
261
-
262
-
263
-
264
-
265
-
266
-
267
-
268
-
269
-
270
-
271
-
272
-
273
-
274
-
275
-
276
-
277
-
278
-
279
-
280
-
281
-
282
-
283
-
284
-
285
-
286
-
287
-
288
-
289
-
290
-
291
-
292
-
293
-
294
-
295
-
296
-
297
-
298
-
299
-
300
-
301
-
302
-
303
-
304
-
305
-
306
-
307
-
308
-
309
-
310
-
311
-
312
-
313
-
314
-
315
-
316
-
317
-
318
-
319
-
320
-
321
-
322
-
323
-
324
-
325
-
326
-
327
-
328
-
329
-
330
-
331
-
332
-
333
-
334
-
335
-
336
-
337
-
338
-
339
-
340
-
341
-
342
 |
 |
87
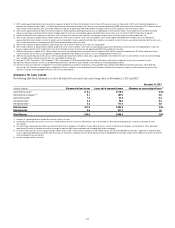
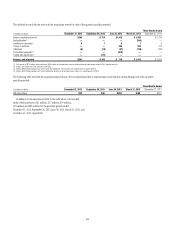
Based on the limited number of Revolving HELOCs that have begun
amortization as of December 31, 2013, approximately 6.0% of the amortizing
home equity loans were 30+ days past due compared to 2.8% of the total
outstanding home equity loan portfolio (amortizing and non-amortizing).
However, these resets have generally occurred during a period of declining
interest rates, which Citi believes has likely reduced the overall “payment
shock” to the borrower. Citi continues to monitor this reset risk closely,
particularly as it approaches 2015, and Citi will continue to consider any
potential impact in determining its allowance for loan loss reserves. In
addition, management continues to review additional actions to offset
potential reset risk, such as extending offers to non-amortizing home equity
loan borrowers to convert the non-amortizing home equity loan to a fixed-
rate amortizing loan. See also “Risk Factors—Business and Operational
Risks” above.
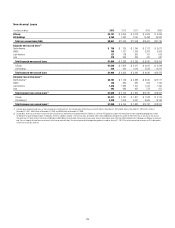
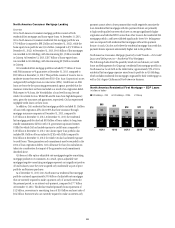
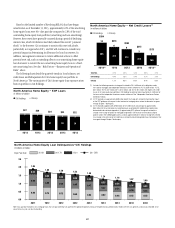
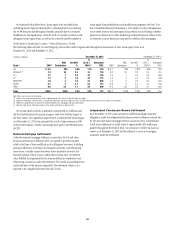
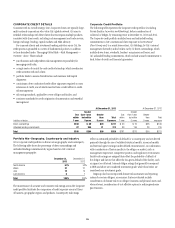
The following charts detail the quarterly trends in loan balances, net
credit losses and delinquencies for Citi’s home equity loan portfolio in
North America. The vast majority of Citi’s home equity loan exposure arises
from its portfolio in Citi Holdings.
4Q’133Q’132Q’131Q’134Q’12
34
3
33
3
31
3
30
3
29
3
North America Home Equity — EOP Loans
In billions of dollars
Citi Holdings Citicorp
$37 $36 $34 $32
$33
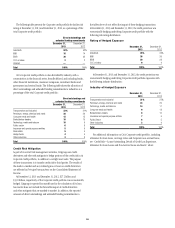
4Q’13(3)
3Q’132Q’131Q’134Q’12(2)
385
10
312
6
274
6
212
3
169
3
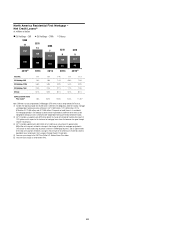
North America Home Equity — Net Credit Losses(1)
In millions of dollars
Citi Holdings Citicorp
$394
$318 $280
$173
$215
Total NCL 4.1% 3.5% 3.2% 2.5% 2.1%
Citi Holdings 4.4% 3.8% 3.4% 2.7% 2.3%
Citicorp 1.2% 0.8% 0.8% 0.4% 0.5%
(1) Includes the following amounts of charge-offs related to Citi’s fulfillment of its obligations under
the national mortgage and independent foreclosure review settlements: 4Q’12, $30 million; 1Q’13,
$51 million; 2Q’13, $12 million; 3Q’13, $14 million; and 4Q’13, $15 million. Citi expects net credit
losses in its home equity loan portfolio in Citi Holdings to continue to be impacted by its fulfillment of
the terms of the independent foreclosure review settlement. See “Independent Foreclosure Review
Settlement” below.
(2) 4Q’12 excludes an approximately $30 million benefit to charge-offs related to finalizing the impact
of the OCC guidance with respect to the treatment of mortgage loans where the borrower has gone
through Chapter 7 bankruptcy.
(3) 4Q’13 excludes approximately $100 million of net credit losses consisting of (i) approximately
$64 million for the acceleration of accounting losses associated with modified home equity loans
determined to be collateral dependent, (ii) approximately $22 million of charge-offs related to a
change in the charge-off policy for mortgages originated in CitiFinancial to more closely align to
policies used in the CitiMortgage business, and (iii) approximately $14 million of charge-offs related
to a change in the estimate of net credit losses related to collateral dependent loans to borrowers that
have gone through Chapter 7 bankruptcy.
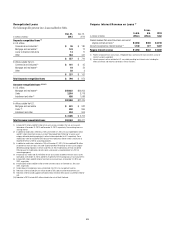
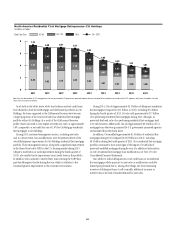
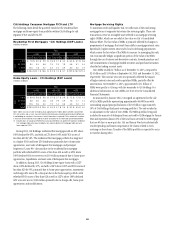
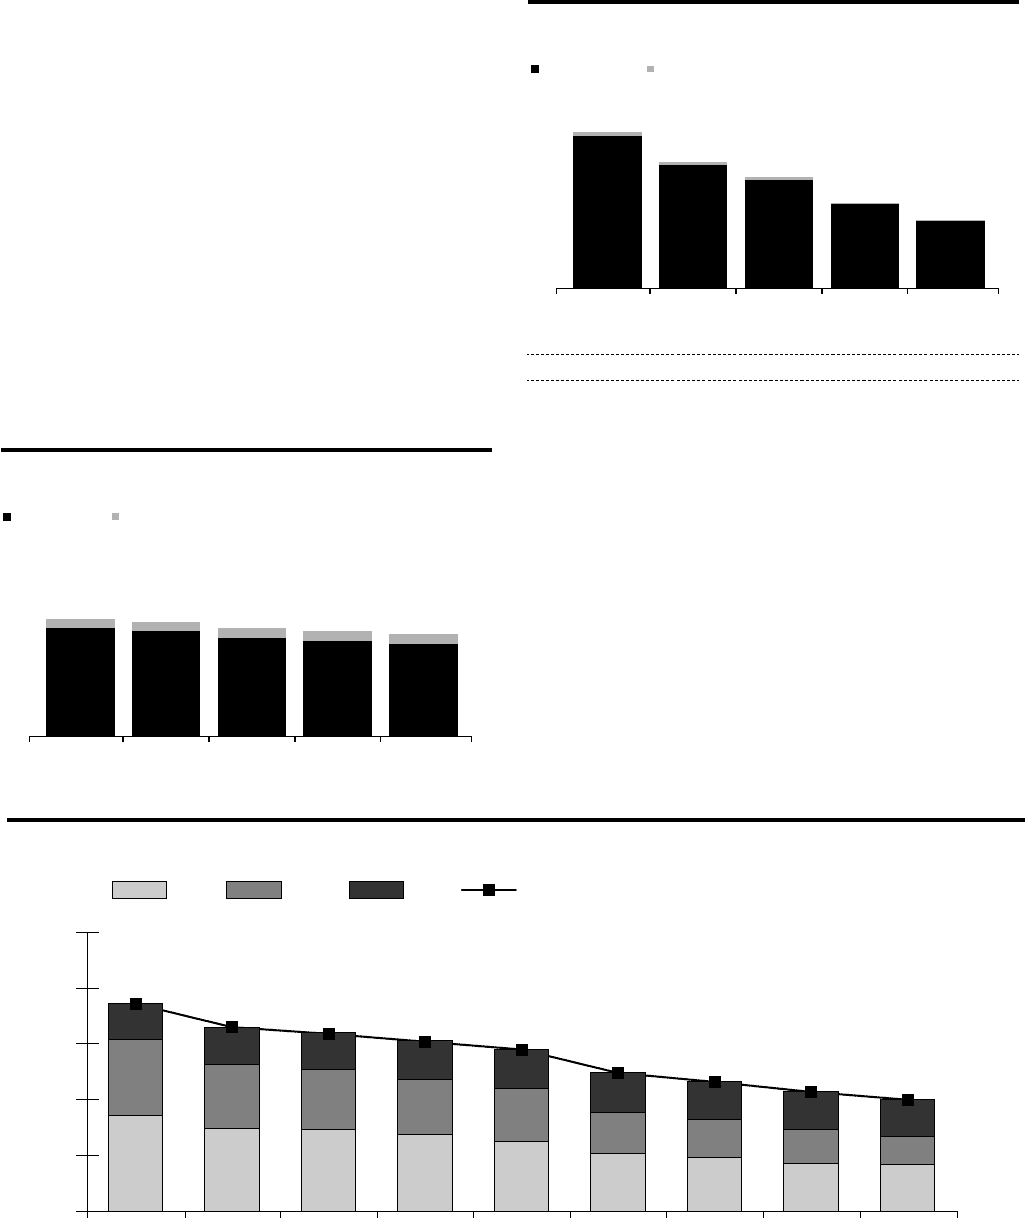
North America Home Equity Loan Delinquencies—Citi Holdings
In billions of dollars
Days Past Due:
0.0
0.5
1.0
1.5
2.0
2.5
30+ DPD
180+
90-179
30-89
4Q133Q132Q131Q134Q123Q122Q121Q124Q11
0.86 0.74 0.73 0.69 0.63 0.52 0.48 0.43 0.42
0.68 0.58 0.54 0.49 0.47 0.37 0.34 0.30 0.25
0.32
0.33 0.33 0.35 0.35
0.35 0.34 0.33
0.34
1.86
1.65 1.59 1.52 1.45
1.24 1.16 1.07 1.00
Note: Days past due excludes (i) U.S. mortgage loans that are guaranteed by U.S. government-sponsored agencies, because the potential loss predominantly resides with the U.S. agencies, and (ii) loans recorded at fair
value. Totals may not sum due to rounding.