Citibank 2013 Annual Report Download - page 269
Download and view the complete annual report
Please find page 269 of the 2013 Citibank annual report below. You can navigate through the pages in the report by either clicking on the pages listed below, or by using the keyword search tool below to find specific information within the annual report.-
 1
1 -
2
-
3
-
4
-
5
-
6
-
7
-
8
-
9
-
10
-
11
-
12
-
13
-
14
-
15
-
16
-
17
-
18
-
19
-
20
-
21
-
22
-
23
-
24
-
25
-
26
-
27
-
28
-
29
-
30
-
31
-
32
-
33
-
34
-
35
-
36
-
37
-
38
-
39
-
40
-
41
-
42
-
43
-
44
-
45
-
46
-
47
-
48
-
49
-
50
-
51
-
52
-
53
-
54
-
55
-
56
-
57
-
58
-
59
-
60
-
61
-
62
-
63
-
64
-
65
-
66
-
67
-
68
-
69
-
70
-
71
-
72
-
73
-
74
-
75
-
76
-
77
-
78
-
79
-
80
-
81
-
82
-
83
-
84
-
85
-
86
-
87
-
88
-
89
-
90
-
91
-
92
-
93
-
94
-
95
-
96
-
97
-
98
-
99
-
100
-
101
-
102
-
103
-
104
-
105
-
106
-
107
-
108
-
109
-
110
-
111
-
112
-
113
-
114
-
115
-
116
-
117
-
118
-
119
-
120
-
121
-
122
-
123
-
124
-
125
-
126
-
127
-
128
-
129
-
130
-
131
-
132
-
133
-
134
-
135
-
136
-
137
-
138
-
139
-
140
-
141
-
142
-
143
-
144
-
145
-
146
-
147
-
148
-
149
-
150
-
151
-
152
-
153
-
154
-
155
-
156
-
157
-
158
-
159
-
160
-
161
-
162
-
163
-
164
-
165
-
166
-
167
-
168
-
169
-
170
-
171
-
172
-
173
-
174
-
175
-
176
-
177
-
178
-
179
-
180
-
181
-
182
-
183
-
184
-
185
-
186
-
187
-
188
-
189
-
190
-
191
-
192
-
193
-
194
-
195
-
196
-
197
-
198
-
199
-
200
-
201
-
202
-
203
-
204
-
205
-
206
-
207
-
208
-
209
-
210
-
211
-
212
-
213
-
214
-
215
-
216
-
217
-
218
-
219
-
220
-
221
-
222
-
223
-
224
-
225
-
226
-
227
-
228
-
229
-
230
-
231
-
232
-
233
-
234
-
235
-
236
-
237
-
238
-
239
-
240
-
241
-
242
-
243
-
244
-
245
-
246
-
247
-
248
-
249
-
250
-
251
-
252
-
253
-
254
-
255
-
256
-
257
-
258
-
 259
259 -
 260
260 -
 261
261 -
 262
262 -
 263
263 -
 264
264 -
 265
265 -
 266
266 -
 267
267 -
 268
268 -
 269
269 -
 270
270 -
 271
271 -
 272
272 -
 273
273 -
 274
274 -
 275
275 -
 276
276 -
 277
277 -
 278
278 -
 279
279 -
280
-
281
-
282
-
283
-
284
-
285
-
286
-
287
-
288
-
289
-
290
-
291
-
292
-
293
-
294
-
295
-
296
-
297
-
298
-
299
-
300
-
301
-
302
-
303
-
304
-
305
-
306
-
307
-
308
-
309
-
310
-
311
-
312
-
313
-
314
-
315
-
316
-
317
-
318
-
319
-
320
-
321
-
322
-
323
-
324
-
325
-
326
-
327
-
328
-
329
-
330
-
331
-
332
-
333
-
334
-
335
-
336
-
337
-
338
-
339
-
340
-
341
-
342
 |
 |

251
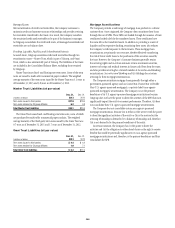
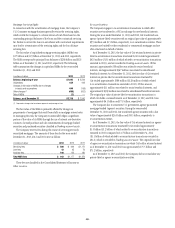
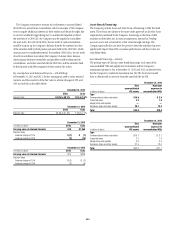
Mortgage Servicing Rights
In connection with the securitization of mortgage loans, the Company’s
U.S. Consumer mortgage business generally retains the servicing rights,
which entitle the Company to a future stream of cash flows based on the
outstanding principal balances of the loans and the contractual servicing
fee. Failure to service the loans in accordance with contractual requirements
may lead to a termination of the servicing rights and the loss of future
servicing fees.
The fair value of capitalized mortgage servicing rights (MSRs) was
$2.7 billion and $1.9 billion at December 31, 2013 and 2012, respectively.
The MSRs correspond to principal loan balances of $286 billion and $325
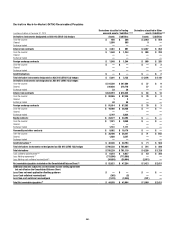
billion as of December 31, 2013 and 2012, respectively. The following
table summarizes the changes in capitalized MSRs for the years ended
December 31, 2013 and 2012:
In millions of dollars 2013 2012
Balance, beginning of year $1,942 $ 2,569
Originations 634 423
Changes in fair value of MSRs due to changes
in inputs and assumptions 640 (198)
Other changes (1) (496) (852)
Sale of MSRs (2) —
Balance, as of December 31 $2,718 $ 1,942
(1) Represents changes due to customer payments and passage of time.
The fair value of the MSRs is primarily affected by changes in
prepayments of mortgages that result from shifts in mortgage interest rates.
In managing this risk, the Company economically hedges a significant
portion of the value of its MSRs through the use of interest rate derivative
contracts, forward purchase and sale commitments of mortgage-backed
securities and purchased securities classified as Trading account assets.
The Company receives fees during the course of servicing previously
securitized mortgages. The amounts of these fees for the years ended
December 31, 2013, 2012 and 2011 were as follows:
In millions of dollars 2013 2012 2011
Servicing fees $ 800 $ 990 $1,170
Late fees 42 65 76
Ancillary fees 100 122 130
Total MSR fees $ 942 $1,177 $1,376
These fees are classified in the Consolidated Statement of Income as
Other revenue.
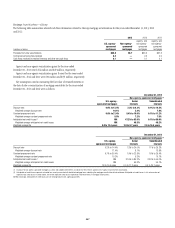
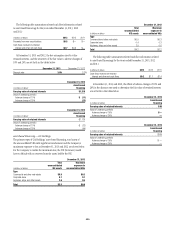
Re-securitizations
The Company engages in re-securitization transactions in which debt
securities are transferred to a VIE in exchange for new beneficial interests.
During the years ended December 31, 2013 and 2012, Citi transferred non-
agency (private-label) securities with an original par value of approximately
$955 million and $1.5 billion, respectively, to re-securitization entities. These
securities are backed by either residential or commercial mortgages and are
often structured on behalf of clients.
As of December 31, 2013, the fair value of Citi-retained interests in private-
label re-securitization transactions structured by Citi totaled approximately
$425 million ($131 million of which related to re-securitization transactions
executed in 2013), and are recorded in Trading account assets. Of this
amount, approximately $58 million was related to senior beneficial
interests, and approximately $367 million was related to subordinated
beneficial interests. As of December 31, 2012, the fair value of Citi-retained
interests in private-label re-securitization transactions structured by
Citi totaled approximately $380 million ($128 million of which related
to re-securitization transactions executed in 2012). Of this amount,
approximately $11 million was related to senior beneficial interests, and
approximately $369 million was related to subordinated beneficial interests.
The original par value of private-label re-securitization transactions in
which Citi holds a retained interest as of December 31, 2013 and 2012 was
approximately $6.1 billion and $7.1 billion, respectively.
The Company also re-securitizes U.S. government-agency guaranteed
mortgage-backed (agency) securities. During the years ended
December 31, 2013 and 2012, Citi transferred agency securities with a fair
value of approximately $26.3 billion and $30.3 billion, respectively, to
re-securitization entities.
As of December 31, 2013, the fair value of Citi-retained interests in agency
re-securitization transactions structured by Citi totaled approximately
$1.5 billion ($1.2 billion of which related to re-securitization transactions
executed in 2013) compared to $1.7 billion as of December 31, 2012
($1.1 billion of which related to re-securitization transactions executed in
2012), which is recorded in Trading account assets. The original fair value
of agency re-securitization transactions in which Citi holds a retained interest
as of December 31, 2013 and 2012 was approximately $75.5 billion and
$71.2 billion, respectively.
As of December 31, 2013 and 2012, the Company did not consolidate any
private-label or agency re-securitization entities.