Citibank 2013 Annual Report Download - page 232
Download and view the complete annual report
Please find page 232 of the 2013 Citibank annual report below. You can navigate through the pages in the report by either clicking on the pages listed below, or by using the keyword search tool below to find specific information within the annual report.-
 1
1 -
2
-
3
-
4
-
5
-
6
-
7
-
8
-
9
-
10
-
11
-
12
-
13
-
14
-
15
-
16
-
17
-
18
-
19
-
20
-
21
-
22
-
23
-
24
-
25
-
26
-
27
-
28
-
29
-
30
-
31
-
32
-
33
-
34
-
35
-
36
-
37
-
38
-
39
-
40
-
41
-
42
-
43
-
44
-
45
-
46
-
47
-
48
-
49
-
50
-
51
-
52
-
53
-
54
-
55
-
56
-
57
-
58
-
59
-
60
-
61
-
62
-
63
-
64
-
65
-
66
-
67
-
68
-
69
-
70
-
71
-
72
-
73
-
74
-
75
-
76
-
77
-
78
-
79
-
80
-
81
-
82
-
83
-
84
-
85
-
86
-
87
-
88
-
89
-
90
-
91
-
92
-
93
-
94
-
95
-
96
-
97
-
98
-
99
-
100
-
101
-
102
-
103
-
104
-
105
-
106
-
107
-
108
-
109
-
110
-
111
-
112
-
113
-
114
-
115
-
116
-
117
-
118
-
119
-
120
-
121
-
122
-
123
-
124
-
125
-
126
-
127
-
128
-
129
-
130
-
131
-
132
-
133
-
134
-
135
-
136
-
137
-
138
-
139
-
140
-
141
-
142
-
143
-
144
-
145
-
146
-
147
-
148
-
149
-
150
-
151
-
152
-
153
-
154
-
155
-
156
-
157
-
158
-
159
-
160
-
161
-
162
-
163
-
164
-
165
-
166
-
167
-
168
-
169
-
170
-
171
-
172
-
173
-
174
-
175
-
176
-
177
-
178
-
179
-
180
-
181
-
182
-
183
-
184
-
185
-
186
-
187
-
188
-
189
-
190
-
191
-
192
-
193
-
194
-
195
-
196
-
197
-
198
-
199
-
200
-
201
-
202
-
203
-
204
-
205
-
206
-
207
-
208
-
209
-
210
-
211
-
212
-
213
-
214
-
215
-
216
-
217
-
218
-
219
-
220
-
221
-
 222
222 -
 223
223 -
 224
224 -
 225
225 -
 226
226 -
 227
227 -
 228
228 -
 229
229 -
 230
230 -
 231
231 -
 232
232 -
 233
233 -
 234
234 -
 235
235 -
 236
236 -
 237
237 -
 238
238 -
 239
239 -
 240
240 -
 241
241 -
 242
242 -
243
-
244
-
245
-
246
-
247
-
248
-
249
-
250
-
251
-
252
-
253
-
254
-
255
-
256
-
257
-
258
-
259
-
260
-
261
-
262
-
263
-
264
-
265
-
266
-
267
-
268
-
269
-
270
-
271
-
272
-
273
-
274
-
275
-
276
-
277
-
278
-
279
-
280
-
281
-
282
-
283
-
284
-
285
-
286
-
287
-
288
-
289
-
290
-
291
-
292
-
293
-
294
-
295
-
296
-
297
-
298
-
299
-
300
-
301
-
302
-
303
-
304
-
305
-
306
-
307
-
308
-
309
-
310
-
311
-
312
-
313
-
314
-
315
-
316
-
317
-
318
-
319
-
320
-
321
-
322
-
323
-
324
-
325
-
326
-
327
-
328
-
329
-
330
-
331
-
332
-
333
-
334
-
335
-
336
-
337
-
338
-
339
-
340
-
341
-
342
 |
 |

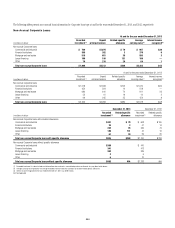
214
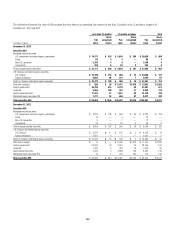
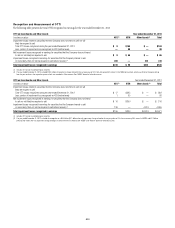
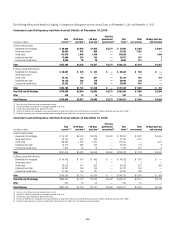
The following is a 12-month roll-forward of the credit-related impairments recognized in earnings for AFS and HTM debt securities held as of December 31,
2013 that the Company does not intend to sell nor likely will be required to sell:
Cumulative OTTI credit losses recognized in earnings
In millions of dollars
Dec. 31, 2012
balance
Credit impairments
recognized in
earnings on
securities not
previously impaired
Credit impairments
recognized in
earnings on
securities that have
been previously
impaired
Reductions due to
credit-impaired
securities sold,
transferred or
matured
Dec. 31, 2013
balance
AFS debt securities
Mortgage-backed securities $ 295 $— $— $ — $295
Foreign government securities 169 — 2 — 171
Corporate 116 — — (3) 113
All other debt securities 137 7 — — 144
Total OTTI credit losses recognized for
AFS debt securities $ 717 $ 7 $ 2 $ (3) $723
HTM debt securities
Mortgage-backed securities (1) $ 869 $47 $ 7 $(245) $678
Corporate 56 — — — 56
All other debt securities 135 2 — (4) 133
Total OTTI credit losses recognized for
HTM debt securities $1,060 $49 $ 7 $(249) $867
(1) Primarily consists of Alt-A securities.
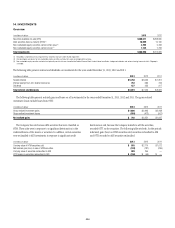
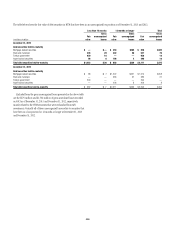
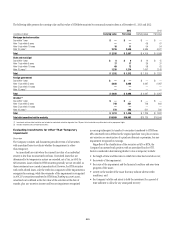
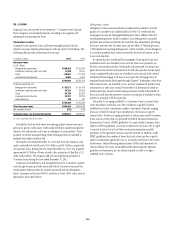
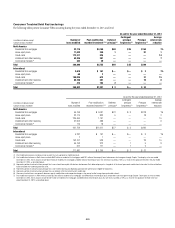
Investments in Alternative Investment Funds That
Calculate Net Asset Value per Share
The Company holds investments in certain alternative investment funds
that calculate net asset value (NAV) per share, including hedge funds,
private equity funds, funds of funds and real estate funds. The Company’s
investments include co-investments in funds that are managed by the
Company and investments in funds that are managed by third parties.
Investments in funds are generally classified as non-marketable equity
securities carried at fair value.
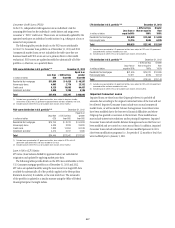
The fair values of these investments are estimated using the NAV per share
of the Company’s ownership interest in the funds, where it is not probable
that the Company will sell an investment at a price other than the NAV.
Fair value Unfunded commitments
Redemption frequency
(if currently eligible)
monthly, quarterly, annually Redemption notice period
In millions of dollars 2013 2012 2013 2012
Hedge funds $ 751 $1,316 $ — $ — Generally quarterly 10-95 days
Private equity funds (1)(2) 794 837 170 342 — —
Real estate funds (2)(3) 294 228 36 57 — —
Total (4) $1,839 $2,381 $206 $399 — —
(1) Private equity funds include funds that invest in infrastructure, leveraged buyout transactions, emerging markets and venture capital.
(2) With respect to the Company’s investments in private equity funds and real estate funds, distributions from each fund will be received as the underlying assets held by these funds are liquidated. It is estimated that the
underlying assets of these funds will be liquidated over a period of several years as market conditions allow. Private equity and real estate funds do not allow redemption of investments by their investors. Investors are
permitted to sell or transfer their investments, subject to the approval of the general partner or investment manager of these funds, which generally may not be unreasonably withheld.
(3) Includes several real estate funds that invest primarily in commercial real estate in the U.S., Europe and Asia.
(4) Included in the total fair value of investments above are $1.6 billion and $0.4 billion of fund assets that are valued using NAVs provided by third-party asset managers as of December 31, 2013 and December 31, 2012,
respectively. The increase in the investments valued using NAVs provided by third party asset managers was primarily driven by the sale of certain of the Citi Capital Advisors business as discussed in Note 2 to the
Consolidated Financial Statements. Amounts presented exclude investments in funds that are consolidated by Citi.