Citibank 2013 Annual Report Download - page 209
Download and view the complete annual report
Please find page 209 of the 2013 Citibank annual report below. You can navigate through the pages in the report by either clicking on the pages listed below, or by using the keyword search tool below to find specific information within the annual report.-
 1
1 -
2
-
3
-
4
-
5
-
6
-
7
-
8
-
9
-
10
-
11
-
12
-
13
-
14
-
15
-
16
-
17
-
18
-
19
-
20
-
21
-
22
-
23
-
24
-
25
-
26
-
27
-
28
-
29
-
30
-
31
-
32
-
33
-
34
-
35
-
36
-
37
-
38
-
39
-
40
-
41
-
42
-
43
-
44
-
45
-
46
-
47
-
48
-
49
-
50
-
51
-
52
-
53
-
54
-
55
-
56
-
57
-
58
-
59
-
60
-
61
-
62
-
63
-
64
-
65
-
66
-
67
-
68
-
69
-
70
-
71
-
72
-
73
-
74
-
75
-
76
-
77
-
78
-
79
-
80
-
81
-
82
-
83
-
84
-
85
-
86
-
87
-
88
-
89
-
90
-
91
-
92
-
93
-
94
-
95
-
96
-
97
-
98
-
99
-
100
-
101
-
102
-
103
-
104
-
105
-
106
-
107
-
108
-
109
-
110
-
111
-
112
-
113
-
114
-
115
-
116
-
117
-
118
-
119
-
120
-
121
-
122
-
123
-
124
-
125
-
126
-
127
-
128
-
129
-
130
-
131
-
132
-
133
-
134
-
135
-
136
-
137
-
138
-
139
-
140
-
141
-
142
-
143
-
144
-
145
-
146
-
147
-
148
-
149
-
150
-
151
-
152
-
153
-
154
-
155
-
156
-
157
-
158
-
159
-
160
-
161
-
162
-
163
-
164
-
165
-
166
-
167
-
168
-
169
-
170
-
171
-
172
-
173
-
174
-
175
-
176
-
177
-
178
-
179
-
180
-
181
-
182
-
183
-
184
-
185
-
186
-
187
-
188
-
189
-
190
-
191
-
192
-
193
-
194
-
195
-
196
-
197
-
198
-
 199
199 -
 200
200 -
 201
201 -
 202
202 -
 203
203 -
 204
204 -
 205
205 -
 206
206 -
 207
207 -
 208
208 -
 209
209 -
 210
210 -
 211
211 -
 212
212 -
 213
213 -
 214
214 -
 215
215 -
 216
216 -
 217
217 -
 218
218 -
 219
219 -
220
-
221
-
222
-
223
-
224
-
225
-
226
-
227
-
228
-
229
-
230
-
231
-
232
-
233
-
234
-
235
-
236
-
237
-
238
-
239
-
240
-
241
-
242
-
243
-
244
-
245
-
246
-
247
-
248
-
249
-
250
-
251
-
252
-
253
-
254
-
255
-
256
-
257
-
258
-
259
-
260
-
261
-
262
-
263
-
264
-
265
-
266
-
267
-
268
-
269
-
270
-
271
-
272
-
273
-
274
-
275
-
276
-
277
-
278
-
279
-
280
-
281
-
282
-
283
-
284
-
285
-
286
-
287
-
288
-
289
-
290
-
291
-
292
-
293
-
294
-
295
-
296
-
297
-
298
-
299
-
300
-
301
-
302
-
303
-
304
-
305
-
306
-
307
-
308
-
309
-
310
-
311
-
312
-
313
-
314
-
315
-
316
-
317
-
318
-
319
-
320
-
321
-
322
-
323
-
324
-
325
-
326
-
327
-
328
-
329
-
330
-
331
-
332
-
333
-
334
-
335
-
336
-
337
-
338
-
339
-
340
-
341
-
342
 |
 |

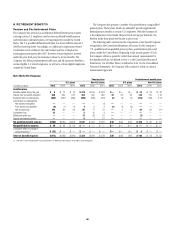
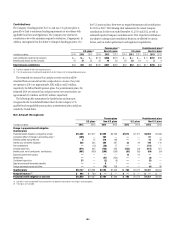
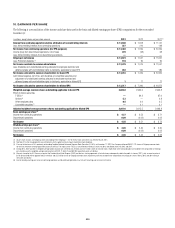
191
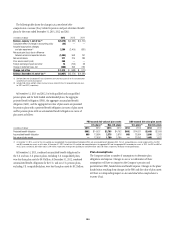
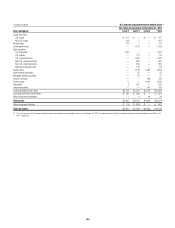
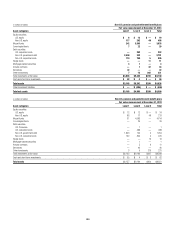
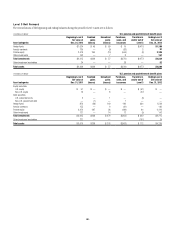
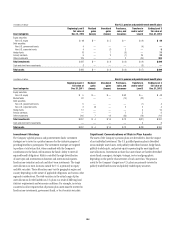
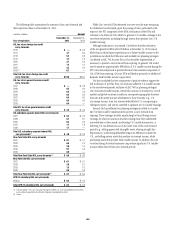
Level 3 Roll Forward
The reconciliations of the beginning and ending balances during the period for Level 3 assets are as follows:
In millions of dollars U.S. pension and postretirement benefit plans
Asset categories
Beginning Level 3
fair value at
Dec. 31, 2012
Realized
gains
(losses)
Unrealized
gains
(losses)
Purchases,
sales, and
issuances
Transfers in
and/or out of
Level 3
Ending Level 3
fair value at
Dec. 31, 2013
Hedge funds $1,524 $ 45 $ 69 $ 19 $(477) $ 1,180
Annuity contracts 130 — (9) (33) 3 91
Private equity 2,419 264 (10) (564) (3) 2,106
Other investments 142 — 7 8 — 157
Total investments $4,215 $ 309 $ 57 $(570) $(477) $3,534
Other investment receivables 24 — — 28 — 52
Total assets $4,239 $ 309 $ 57 $ (542) $(477) $ 3,586
In millions of dollars U.S. pension and postretirement benefit plans
Asset categories
Beginning Level 3
fair value at
Dec. 31, 2011
Realized
gains
(losses)
Unrealized
gains
(losses)
Purchases,
sales, and
issuances
Transfers in
and/or out of
Level 3
Ending Level 3
fair value at
Dec. 31, 2012
Equity securities
U.S. equity $ 51 $ — $ — $ — $ (51) $ —
Non-U.S. equity 19 — 8 — (27) —
Debt securities
U.S. corporate bonds 5 — 1 — (6) —
Non-U.S. government debt — (1) — 1 — —
Hedge funds 870 (28) 149 199 334 1,524
Annuity contracts 155 — 6 (31) — 130
Private equity 2,474 267 98 (484) 64 2,419
Other investments 121 — 14 12 (5) 142
Total investments $ 3,695 $ 238 $ 276 $ (303) $ 309 $ 4,215
Other investment receivables 221 — — — (197) 24
Total assets $ 3,916 $238 $ 276 $(303) $ 112 $ 4,239