Citibank 2013 Annual Report Download - page 224
Download and view the complete annual report
Please find page 224 of the 2013 Citibank annual report below. You can navigate through the pages in the report by either clicking on the pages listed below, or by using the keyword search tool below to find specific information within the annual report.-
 1
1 -
2
-
3
-
4
-
5
-
6
-
7
-
8
-
9
-
10
-
11
-
12
-
13
-
14
-
15
-
16
-
17
-
18
-
19
-
20
-
21
-
22
-
23
-
24
-
25
-
26
-
27
-
28
-
29
-
30
-
31
-
32
-
33
-
34
-
35
-
36
-
37
-
38
-
39
-
40
-
41
-
42
-
43
-
44
-
45
-
46
-
47
-
48
-
49
-
50
-
51
-
52
-
53
-
54
-
55
-
56
-
57
-
58
-
59
-
60
-
61
-
62
-
63
-
64
-
65
-
66
-
67
-
68
-
69
-
70
-
71
-
72
-
73
-
74
-
75
-
76
-
77
-
78
-
79
-
80
-
81
-
82
-
83
-
84
-
85
-
86
-
87
-
88
-
89
-
90
-
91
-
92
-
93
-
94
-
95
-
96
-
97
-
98
-
99
-
100
-
101
-
102
-
103
-
104
-
105
-
106
-
107
-
108
-
109
-
110
-
111
-
112
-
113
-
114
-
115
-
116
-
117
-
118
-
119
-
120
-
121
-
122
-
123
-
124
-
125
-
126
-
127
-
128
-
129
-
130
-
131
-
132
-
133
-
134
-
135
-
136
-
137
-
138
-
139
-
140
-
141
-
142
-
143
-
144
-
145
-
146
-
147
-
148
-
149
-
150
-
151
-
152
-
153
-
154
-
155
-
156
-
157
-
158
-
159
-
160
-
161
-
162
-
163
-
164
-
165
-
166
-
167
-
168
-
169
-
170
-
171
-
172
-
173
-
174
-
175
-
176
-
177
-
178
-
179
-
180
-
181
-
182
-
183
-
184
-
185
-
186
-
187
-
188
-
189
-
190
-
191
-
192
-
193
-
194
-
195
-
196
-
197
-
198
-
199
-
200
-
201
-
202
-
203
-
204
-
205
-
206
-
207
-
208
-
209
-
210
-
211
-
212
-
213
-
 214
214 -
 215
215 -
 216
216 -
 217
217 -
 218
218 -
 219
219 -
 220
220 -
 221
221 -
 222
222 -
 223
223 -
 224
224 -
 225
225 -
 226
226 -
 227
227 -
 228
228 -
 229
229 -
 230
230 -
 231
231 -
 232
232 -
 233
233 -
 234
234 -
235
-
236
-
237
-
238
-
239
-
240
-
241
-
242
-
243
-
244
-
245
-
246
-
247
-
248
-
249
-
250
-
251
-
252
-
253
-
254
-
255
-
256
-
257
-
258
-
259
-
260
-
261
-
262
-
263
-
264
-
265
-
266
-
267
-
268
-
269
-
270
-
271
-
272
-
273
-
274
-
275
-
276
-
277
-
278
-
279
-
280
-
281
-
282
-
283
-
284
-
285
-
286
-
287
-
288
-
289
-
290
-
291
-
292
-
293
-
294
-
295
-
296
-
297
-
298
-
299
-
300
-
301
-
302
-
303
-
304
-
305
-
306
-
307
-
308
-
309
-
310
-
311
-
312
-
313
-
314
-
315
-
316
-
317
-
318
-
319
-
320
-
321
-
322
-
323
-
324
-
325
-
326
-
327
-
328
-
329
-
330
-
331
-
332
-
333
-
334
-
335
-
336
-
337
-
338
-
339
-
340
-
341
-
342
 |
 |

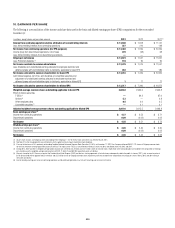
206
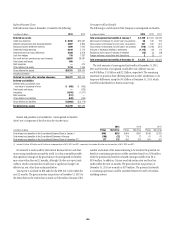
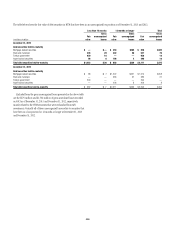
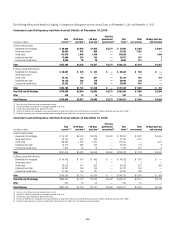
The table below shows the fair value of AFS securities that have been in an unrealized loss position for less than 12 months or for 12 months or longer as of
December 31, 2013 and 2012:
Less than 12 months 12 months or longer Total
In millions of dollars
Fair
value
Gross
unrealized
losses
Fair
value
Gross
unrealized
losses
Fair
value
Gross
unrealized
losses
December 31, 2013
Securities AFS
Mortgage-backed securities
U.S. government-sponsored agency guaranteed $ 19,377 $ 533 $ 5,643 $ 355 $ 25,020 $ 888
Prime 85 3 3 — 88 3
Non-U.S. residential 2,103 4 5 — 2,108 4
Commercial 206 6 28 2 234 8
Total mortgage-backed securities $ 21,771 $ 546 $ 5,679 $ 357 $ 27,450 $ 903
U.S. Treasury and federal agency securities
U.S. Treasury $ 34,780 $ 133 $ 268 $ 14 $ 35,048 $ 147
Agency obligations 6,692 66 101 1 6,793 67
Total U.S. Treasury and federal agency securities $ 41,472 $ 199 $ 369 $ 15 $ 41,841 $ 214
State and municipal $ 595 $ 29 $ 11,447 $1,976 $ 12,042 $ 2,005
Foreign government 35,783 614 5,778 63 41,561 677
Corporate 4,565 108 387 11 4,952 119
Asset-backed securities 11,207 57 1,931 63 13,138 120
Marketable equity securities AFS 1,271 92 806 91 2,077 183
Total securities AFS $116,664 $1,645 $ 26,397 $2,576 $143,061 $4,221
December 31, 2012
Securities AFS
Mortgage-backed securities
U.S. government-sponsored agency guaranteed $ 8,759 $ 138 $ 464 $ 25 $ 9,223 $ 163
Prime 15 — 5 — 20 —
Non-U.S. residential 5 — 7 — 12 —
Commercial 29 — 24 3 53 3
Total mortgage-backed securities $ 8,808 $ 138 $ 500 $ 28 $ 9,308 $ 166
U.S. Treasury and federal agency securities
U.S. Treasury $ 9,374 $ 11 $ 105 $ 5 $ 9,479 $ 16
Agency obligations 1,001 4 — — 1,001 4
Total U.S. Treasury and federal agency securities $ 10,375 $ 15 $ 105 $ 5 $ 10,480 $ 20
State and municipal $ 10 $ — $ 11,095 $1,820 $ 11,105 $ 1,820
Foreign government 24,235 78 3,910 76 28,145 154
Corporate 1,420 8 225 18 1,645 26
Asset-backed securities 1,942 4 2,888 139 4,830 143
Marketable equity securities AFS 15 1 764 144 779 145
Total securities AFS $ 46,805 $ 244 $ 19,487 $ 2,230 $ 66,292 $ 2,474