Citibank 2013 Annual Report Download - page 121
Download and view the complete annual report
Please find page 121 of the 2013 Citibank annual report below. You can navigate through the pages in the report by either clicking on the pages listed below, or by using the keyword search tool below to find specific information within the annual report.-
 1
1 -
2
-
3
-
4
-
5
-
6
-
7
-
8
-
9
-
10
-
11
-
12
-
13
-
14
-
15
-
16
-
17
-
18
-
19
-
20
-
21
-
22
-
23
-
24
-
25
-
26
-
27
-
28
-
29
-
30
-
31
-
32
-
33
-
34
-
35
-
36
-
37
-
38
-
39
-
40
-
41
-
42
-
43
-
44
-
45
-
46
-
47
-
48
-
49
-
50
-
51
-
52
-
53
-
54
-
55
-
56
-
57
-
58
-
59
-
60
-
61
-
62
-
63
-
64
-
65
-
66
-
67
-
68
-
69
-
70
-
71
-
72
-
73
-
74
-
75
-
76
-
77
-
78
-
79
-
80
-
81
-
82
-
83
-
84
-
85
-
86
-
87
-
88
-
89
-
90
-
91
-
92
-
93
-
94
-
95
-
96
-
97
-
98
-
99
-
100
-
101
-
102
-
103
-
104
-
105
-
106
-
107
-
108
-
109
-
110
-
 111
111 -
 112
112 -
 113
113 -
 114
114 -
 115
115 -
 116
116 -
 117
117 -
 118
118 -
 119
119 -
 120
120 -
 121
121 -
 122
122 -
 123
123 -
 124
124 -
 125
125 -
 126
126 -
 127
127 -
 128
128 -
 129
129 -
 130
130 -
 131
131 -
132
-
133
-
134
-
135
-
136
-
137
-
138
-
139
-
140
-
141
-
142
-
143
-
144
-
145
-
146
-
147
-
148
-
149
-
150
-
151
-
152
-
153
-
154
-
155
-
156
-
157
-
158
-
159
-
160
-
161
-
162
-
163
-
164
-
165
-
166
-
167
-
168
-
169
-
170
-
171
-
172
-
173
-
174
-
175
-
176
-
177
-
178
-
179
-
180
-
181
-
182
-
183
-
184
-
185
-
186
-
187
-
188
-
189
-
190
-
191
-
192
-
193
-
194
-
195
-
196
-
197
-
198
-
199
-
200
-
201
-
202
-
203
-
204
-
205
-
206
-
207
-
208
-
209
-
210
-
211
-
212
-
213
-
214
-
215
-
216
-
217
-
218
-
219
-
220
-
221
-
222
-
223
-
224
-
225
-
226
-
227
-
228
-
229
-
230
-
231
-
232
-
233
-
234
-
235
-
236
-
237
-
238
-
239
-
240
-
241
-
242
-
243
-
244
-
245
-
246
-
247
-
248
-
249
-
250
-
251
-
252
-
253
-
254
-
255
-
256
-
257
-
258
-
259
-
260
-
261
-
262
-
263
-
264
-
265
-
266
-
267
-
268
-
269
-
270
-
271
-
272
-
273
-
274
-
275
-
276
-
277
-
278
-
279
-
280
-
281
-
282
-
283
-
284
-
285
-
286
-
287
-
288
-
289
-
290
-
291
-
292
-
293
-
294
-
295
-
296
-
297
-
298
-
299
-
300
-
301
-
302
-
303
-
304
-
305
-
306
-
307
-
308
-
309
-
310
-
311
-
312
-
313
-
314
-
315
-
316
-
317
-
318
-
319
-
320
-
321
-
322
-
323
-
324
-
325
-
326
-
327
-
328
-
329
-
330
-
331
-
332
-
333
-
334
-
335
-
336
-
337
-
338
-
339
-
340
-
341
-
342
 |
 |

103
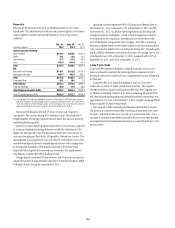
Secured Financing
Secured financing primarily is conducted through Citi’s broker-dealer
subsidiaries to facilitate customer matched-book activity and to efficiently
fund a portion of the trading inventory. Generally, changes in the level of
secured financing are primarily due to fluctuations in trading inventory (on
an end-of-quarter or an average basis).
Secured financing was $204 billion as of December 31, 2013, compared
to $217 billion as of September 30, 2013 and $211 billion as of December 31,
2012. The decrease in secured financing quarter-over-quarter was primarily
driven by a reduction in trading positions in Securities and Banking
businesses (see “Balance Sheet Review” above). Average balances for secured
financing were approximately $216 billion for the quarter ended December
31, 2013, compared to $225 billion for the quarter ended September 30, 2013
and $230 billion for the quarter ended December 31, 2012.
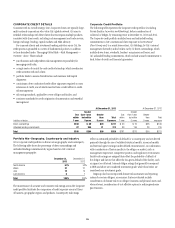
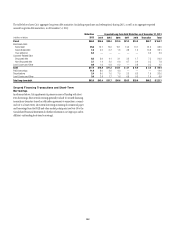
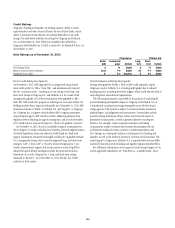
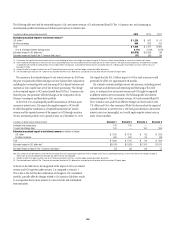
Commercial Paper
The following table sets forth Citi’s commercial paper outstanding for each
of its parent and significant Citibank entities, respectively, for each of the
periods indicated.
In billions of dollars
Dec. 31,
2013
Sept 30,
2013
Dec. 31,
2012
Commercial paper
Parent $ 0.2 $ 0.3 $ 0.4
Significant Citibank entities (1) 17.7 17.6 11.1
Total $17.9 $17.9 $11.5
(1) The increase in the significant Citibank entities’ outstanding commercial paper during 2013 was due
to the consolidation of $7 billion of trade loans in the second quarter of 2013.
Other Short-Term Borrowings
At December 31, 2013, Citi’s other short-term borrowings, which
included borrowings from the FHLB and other market participants, were
approximately $41 billion, unchanged from both the prior quarter and year-
end 2012.
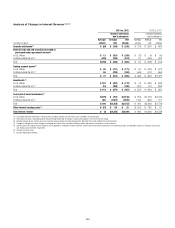
Short-Term Borrowings Table
The following table contains the year-end, average and maximum month-
end amounts for the following respective short-term borrowings categories at
the end of each of the three prior fiscal years.
Federal funds purchased and
securities sold under
agreements to repurchase
Short-term borrowings (1)
Commercial paper Other short-term borrowings (2)
In billions of dollars 2013 2012 2011 2013 2012 2011 2013 2012 2011
Amounts outstanding at year end $203.5 $211.2 $198.4 $17.9 $11.5 $21.3 $41.0 $40.5 $33.1
Average outstanding during the year (3)(4) 229.4 223.8 219.9 16.3 17.9 25.3 39.6 36.3 45.5
Maximum month-end outstanding 239.9 237.1 226.1 18.8 21.9 25.3 44.7 40.6 58.2
Weighted-average interest rate
During the year (3)(4)(5) 1.02% 1.26% 1.45% 0.28% 0.47% 0.28% 1.39% 1.77% 1.28%
At year end (6) 0.59 0.81 1.10 0.26 0.38 0.35 0.87 1.06 1.09
(1) Original maturities of less than one year.
(2) Other short-term borrowings include borrowings from the FHLB and other market participants.
(3) Interest rates and amounts include the effects of risk management activities associated with the respective liability categories.
(4) Average volumes of securities loaned or sold under agreements to repurchase are reported net pursuant to FIN 41 (ASC 210-20-45); average rates exclude the impact of FIN 41 (ASC 210-20-45).
(5) Average rates reflect prevailing local interest rates, including inflationary effects and monetary correction in certain countries.
(6) Based on contractual rates at respective year ends; non-interest-bearing accounts are excluded from the weighted average interest rate calculated at year end.