Citibank 2013 Annual Report Download - page 242
Download and view the complete annual report
Please find page 242 of the 2013 Citibank annual report below. You can navigate through the pages in the report by either clicking on the pages listed below, or by using the keyword search tool below to find specific information within the annual report.-
 1
1 -
2
-
3
-
4
-
5
-
6
-
7
-
8
-
9
-
10
-
11
-
12
-
13
-
14
-
15
-
16
-
17
-
18
-
19
-
20
-
21
-
22
-
23
-
24
-
25
-
26
-
27
-
28
-
29
-
30
-
31
-
32
-
33
-
34
-
35
-
36
-
37
-
38
-
39
-
40
-
41
-
42
-
43
-
44
-
45
-
46
-
47
-
48
-
49
-
50
-
51
-
52
-
53
-
54
-
55
-
56
-
57
-
58
-
59
-
60
-
61
-
62
-
63
-
64
-
65
-
66
-
67
-
68
-
69
-
70
-
71
-
72
-
73
-
74
-
75
-
76
-
77
-
78
-
79
-
80
-
81
-
82
-
83
-
84
-
85
-
86
-
87
-
88
-
89
-
90
-
91
-
92
-
93
-
94
-
95
-
96
-
97
-
98
-
99
-
100
-
101
-
102
-
103
-
104
-
105
-
106
-
107
-
108
-
109
-
110
-
111
-
112
-
113
-
114
-
115
-
116
-
117
-
118
-
119
-
120
-
121
-
122
-
123
-
124
-
125
-
126
-
127
-
128
-
129
-
130
-
131
-
132
-
133
-
134
-
135
-
136
-
137
-
138
-
139
-
140
-
141
-
142
-
143
-
144
-
145
-
146
-
147
-
148
-
149
-
150
-
151
-
152
-
153
-
154
-
155
-
156
-
157
-
158
-
159
-
160
-
161
-
162
-
163
-
164
-
165
-
166
-
167
-
168
-
169
-
170
-
171
-
172
-
173
-
174
-
175
-
176
-
177
-
178
-
179
-
180
-
181
-
182
-
183
-
184
-
185
-
186
-
187
-
188
-
189
-
190
-
191
-
192
-
193
-
194
-
195
-
196
-
197
-
198
-
199
-
200
-
201
-
202
-
203
-
204
-
205
-
206
-
207
-
208
-
209
-
210
-
211
-
212
-
213
-
214
-
215
-
216
-
217
-
218
-
219
-
220
-
221
-
222
-
223
-
224
-
225
-
226
-
227
-
228
-
229
-
230
-
231
-
 232
232 -
 233
233 -
 234
234 -
 235
235 -
 236
236 -
 237
237 -
 238
238 -
 239
239 -
 240
240 -
 241
241 -
 242
242 -
 243
243 -
 244
244 -
 245
245 -
 246
246 -
 247
247 -
 248
248 -
 249
249 -
 250
250 -
 251
251 -
 252
252 -
253
-
254
-
255
-
256
-
257
-
258
-
259
-
260
-
261
-
262
-
263
-
264
-
265
-
266
-
267
-
268
-
269
-
270
-
271
-
272
-
273
-
274
-
275
-
276
-
277
-
278
-
279
-
280
-
281
-
282
-
283
-
284
-
285
-
286
-
287
-
288
-
289
-
290
-
291
-
292
-
293
-
294
-
295
-
296
-
297
-
298
-
299
-
300
-
301
-
302
-
303
-
304
-
305
-
306
-
307
-
308
-
309
-
310
-
311
-
312
-
313
-
314
-
315
-
316
-
317
-
318
-
319
-
320
-
321
-
322
-
323
-
324
-
325
-
326
-
327
-
328
-
329
-
330
-
331
-
332
-
333
-
334
-
335
-
336
-
337
-
338
-
339
-
340
-
341
-
342
 |
 |

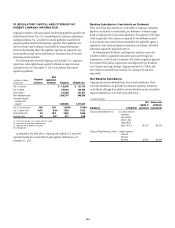
224
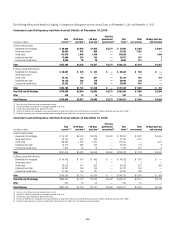
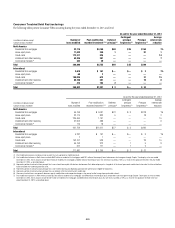
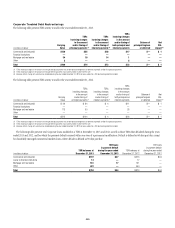
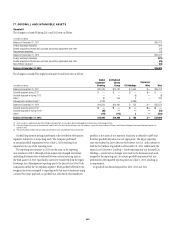
The following tables present non-accrual loan information by Corporate loan type at and for the years ended December 31, 2013, and 2012, respectively:
Non-Accrual Corporate Loans
At and for the year ended December 31, 2013
In millions of dollars
Recorded
investment (1)
Unpaid
principal balance
Related specific
allowance
Average
carrying value (2)
Interest income
recognized (3)
Non-accrual Corporate loans
Commercial and industrial $ 769 $1,074 $ 79 $ 967 $30
Financial institutions 365 382 3 378 9
Mortgage and real estate 515 651 35 585 3
Lease financing 189 190 131 189 —
Other 70 216 20 64 1
Total non-accrual Corporate loans $1,908 $2,513 $268 $2,183 $43
At and for the year ended December 31, 2012
In millions of dollars
Recorded
investment (1)
Unpaid
principal balance
Related specific
allowance
Average
carrying value (2)
Interest income
recognized (3)
Non-accrual Corporate loans
Commercial and industrial $1,078 $1,368 $155 $1,076 $65
Financial institutions 454 504 14 518 —
Mortgage and real estate 680 810 74 811 23
Lease financing 52 61 16 19 2
Other 69 245 25 154 8
Total non-accrual Corporate loans $ 2,333 $2,988 $284 $2,578 $98
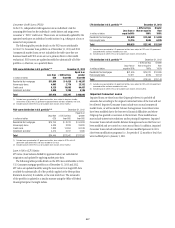
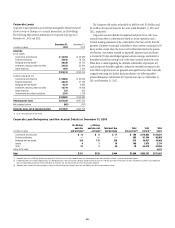
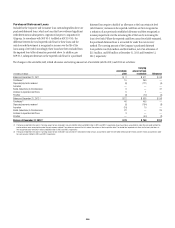
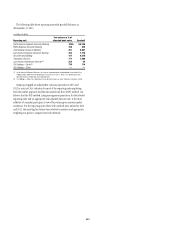
December 31, 2013 December 31, 2012
In millions of dollars
Recorded
investment (1)
Related specific
allowance
Recorded
investment (1)
Related specific
allowance
Non-accrual Corporate loans with valuation allowances
Commercial and industrial $ 401 $ 79 $ 608 $155
Financial institutions 24 3 41 14
Mortgage and real estate 253 35 345 74
Lease financing 186 131 47 16
Other 61 20 59 25
Total non-accrual Corporate loans with specific allowance $ 925 $268 $1,100 $284
Non-accrual Corporate loans without specific allowance
Commercial and industrial $ 368 $ 470
Financial institutions 341 413
Mortgage and real estate 262 335
Lease financing 35
Other 910
Total non-accrual Corporate loans without specific allowance $ 983 N/A $1,233 N/A
(1) Recorded investment in a loan includes net deferred loan fees and costs, unamortized premium or discount, less any direct write-downs.
(2) Average carrying value represents the average recorded investment balance and does not include related specific allowance.
(3) Interest income recognized for the year ended December 31, 2011 was $109 million.
N/A Not Applicable