Citibank 2013 Annual Report Download - page 216
Download and view the complete annual report
Please find page 216 of the 2013 Citibank annual report below. You can navigate through the pages in the report by either clicking on the pages listed below, or by using the keyword search tool below to find specific information within the annual report.-
 1
1 -
 2
2 -
 3
3 -
 4
4 -
 5
5 -
 6
6 -
 7
7 -
 8
8 -
 9
9 -
 10
10 -
 11
11 -
 12
12 -
 13
13 -
 14
14 -
 15
15 -
 16
16 -
 17
17 -
 18
18 -
 19
19 -
 20
20 -
 21
21 -
 22
22 -
 23
23 -
 24
24 -
 25
25 -
 26
26 -
 27
27 -
 28
28 -
 29
29 -
 30
30 -
 31
31 -
 32
32 -
 33
33 -
 34
34 -
 35
35 -
 36
36 -
 37
37 -
 38
38 -
 39
39 -
 40
40 -
 41
41 -
 42
42 -
 43
43 -
 44
44 -
 45
45 -
 46
46 -
 47
47 -
 48
48 -
 49
49 -
 50
50 -
 51
51 -
 52
52 -
 53
53 -
 54
54 -
 55
55 -
 56
56 -
 57
57 -
 58
58 -
 59
59 -
 60
60 -
 61
61 -
 62
62 -
 63
63 -
 64
64 -
 65
65 -
 66
66 -
 67
67 -
 68
68 -
 69
69 -
 70
70 -
 71
71 -
 72
72 -
 73
73 -
 74
74 -
 75
75 -
 76
76 -
 77
77 -
 78
78 -
 79
79 -
 80
80 -
 81
81 -
 82
82 -
 83
83 -
 84
84 -
 85
85 -
 86
86 -
 87
87 -
 88
88 -
 89
89 -
 90
90 -
 91
91 -
 92
92 -
 93
93 -
 94
94 -
 95
95 -
 96
96 -
 97
97 -
 98
98 -
 99
99 -
 100
100 -
 101
101 -
 102
102 -
 103
103 -
 104
104 -
 105
105 -
 106
106 -
 107
107 -
 108
108 -
 109
109 -
 110
110 -
 111
111 -
 112
112 -
 113
113 -
 114
114 -
 115
115 -
 116
116 -
 117
117 -
 118
118 -
 119
119 -
 120
120 -
 121
121 -
 122
122 -
 123
123 -
 124
124 -
 125
125 -
 126
126 -
 127
127 -
 128
128 -
 129
129 -
 130
130 -
 131
131 -
 132
132 -
 133
133 -
 134
134 -
 135
135 -
 136
136 -
 137
137 -
 138
138 -
 139
139 -
 140
140 -
 141
141 -
 142
142 -
 143
143 -
 144
144 -
 145
145 -
 146
146 -
 147
147 -
 148
148 -
 149
149 -
 150
150 -
 151
151 -
 152
152 -
 153
153 -
 154
154 -
 155
155 -
 156
156 -
 157
157 -
 158
158 -
 159
159 -
 160
160 -
 161
161 -
 162
162 -
 163
163 -
 164
164 -
 165
165 -
 166
166 -
 167
167 -
 168
168 -
 169
169 -
 170
170 -
 171
171 -
 172
172 -
 173
173 -
 174
174 -
 175
175 -
 176
176 -
 177
177 -
 178
178 -
 179
179 -
 180
180 -
 181
181 -
 182
182 -
 183
183 -
 184
184 -
 185
185 -
 186
186 -
 187
187 -
 188
188 -
 189
189 -
 190
190 -
 191
191 -
 192
192 -
 193
193 -
 194
194 -
 195
195 -
 196
196 -
 197
197 -
 198
198 -
 199
199 -
 200
200 -
 201
201 -
 202
202 -
 203
203 -
 204
204 -
 205
205 -
 206
206 -
 207
207 -
 208
208 -
 209
209 -
 210
210 -
 211
211 -
 212
212 -
 213
213 -
 214
214 -
 215
215 -
 216
216 -
 217
217 -
 218
218 -
 219
219 -
 220
220 -
 221
221 -
 222
222 -
 223
223 -
 224
224 -
 225
225 -
 226
226 -
 227
227 -
 228
228 -
 229
229 -
 230
230 -
 231
231 -
 232
232 -
 233
233 -
 234
234 -
 235
235 -
 236
236 -
 237
237 -
 238
238 -
 239
239 -
 240
240 -
 241
241 -
 242
242 -
 243
243 -
 244
244 -
 245
245 -
 246
246 -
 247
247 -
 248
248 -
 249
249 -
 250
250 -
 251
251 -
 252
252 -
 253
253 -
 254
254 -
 255
255 -
 256
256 -
 257
257 -
 258
258 -
 259
259 -
 260
260 -
 261
261 -
 262
262 -
 263
263 -
 264
264 -
 265
265 -
 266
266 -
 267
267 -
 268
268 -
 269
269 -
 270
270 -
 271
271 -
 272
272 -
 273
273 -
 274
274 -
 275
275 -
 276
276 -
 277
277 -
 278
278 -
 279
279 -
 280
280 -
 281
281 -
 282
282 -
 283
283 -
 284
284 -
 285
285 -
 286
286 -
 287
287 -
 288
288 -
 289
289 -
 290
290 -
 291
291 -
 292
292 -
 293
293 -
 294
294 -
 295
295 -
 296
296 -
 297
297 -
 298
298 -
 299
299 -
 300
300 -
 301
301 -
 302
302 -
 303
303 -
 304
304 -
 305
305 -
 306
306 -
 307
307 -
 308
308 -
 309
309 -
 310
310 -
 311
311 -
 312
312 -
 313
313 -
 314
314 -
 315
315 -
 316
316 -
 317
317 -
 318
318 -
 319
319 -
 320
320 -
 321
321 -
 322
322 -
 323
323 -
 324
324 -
 325
325 -
 326
326 -
 327
327 -
 328
328 -
 329
329 -
 330
330 -
 331
331 -
 332
332 -
 333
333 -
 334
334 -
 335
335 -
 336
336 -
 337
337 -
 338
338 -
 339
339 -
 340
340 -
 341
341 -
 342
342
 |
 |

198
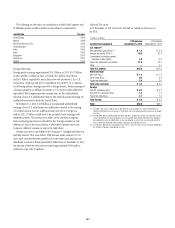
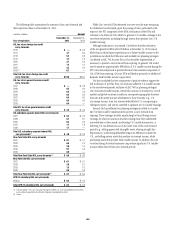
The following table summarizes the amounts of tax carry-forwards and
their expiration dates as of December 31, 2013:
In billions of dollars Amount
Year of expiration
December 31,
2013
December 31,
2012
U.S. tax return foreign tax credit
carry-forwards
2016 $ — $ 0.4
2017 4.7 6.6
2018 5.2 5.3
2019 1.2 1.3
2020 3.1 2.3
2021 1.4 1.9
2022 3.3 4.2
2023 (1) 0.7 —
Total U.S. tax return foreign tax credit
carry-forwards $19.6 $22.0
U.S. tax return general business credit
carry-forwards
2027 $ — $ 0.3
2028 0.4 0.4
2029 0.4 0.4
2030 0.4 0.5
2031 0.4 0.5
2032 0.5 0.5
2033 0.4 —
Total U.S. tax return general business credit
carry-forwards $ 2.5 $ 2.6
U.S. subsidiary separate federal NOL carry-forwards
2027 $ 0.2 $ 0.2
2028 0.1 0.1
2030 0.3 0.3
2031 1.7 1.8
2033 1.7 —
Total U.S. subsidiary separate federal NOL
carry-forwards (2) $ 4.0 $ 2.4
New York State NOL carry-forwards
2027 $ 0.1 $ 0.1
2028 6.5 7.2
2029 2.0 1.9
2030 0.1 0.4
2032 0.9 —
Total New York State NOL carry-forwards (2) $ 9.6 $ 9.6
New York City NOL carry-forwards
2027 $ 0.1 $ 0.1
2028 3.9 3.7
2029 1.5 1.6
2032 0.6 0.2
Total New York City NOL carry-forwards (2) $ 6.1 $ 5.6
APB 23 subsidiary NOL carry-forwards
Various $ 0.2 $ 0.2
Total APB 23 subsidiary NOL carry-forwards $ 0.2 $ 0.2
(1) The $0.7 billion in FTC carry-forwards that expires in 2023 is in a non-consolidated tax return entity
but is eventually expected to be utilized in Citigroup’s consolidated tax return.
(2) Pretax.
While Citi’s net total DTAs decreased year-over-year, the time remaining
for utilization has shortened, given the passage of time, particularly with
respect to the FTC component of the DTAs. Realization of the DTAs will
continue to be driven by Citi’s ability to generate U.S. taxable earnings in the
carry-forward periods, including through actions that optimize Citi’s U.S.
taxable earnings.
Although realization is not assured, Citi believes that the realization
of the recognized net DTAs of $52.8 billion at December 31, 2013 is more
likely than not based upon expectations as to future taxable income in the
jurisdictions in which the DTAs arise and available tax planning strategies
(as defined in ASC 740, Income Taxes) that would be implemented, if
necessary, to prevent a carry-forward from expiring. In general, Citi would
need to generate approximately $98 billion of U.S. taxable income during the
FTC carry-forward periods to prevent this most time sensitive component of
Citi’s DTAs from expiring. Citi’s net DTAs will decline primarily as additional
domestic GAAP taxable income is generated.
Citi has concluded that two components of positive evidence support the
full realization of its DTAs. First, Citi forecasts sufficient U.S. taxable income
in the carryforward periods, exclusive of ASC 740 tax planning strategies.
Citi’s forecasted taxable income, which will continue to be subject to overall
market and global economic conditions, incorporates geographic business
forecasts and taxable income adjustments to those forecasts (e.g., U.S.
tax exempt income, loan loss reserves deductible for U.S. tax reporting in
subsequent years), and actions intended to optimize its U.S. taxable earnings.
Second, Citi has sufficient tax planning strategies available to it under
ASC 740 that would be implemented to prevent a carry-forward from
expiring. These strategies include: repatriating low taxed foreign source
earnings for which an assertion that the earnings have been indefinitely
reinvested has not been made; accelerating U.S. taxable income into, or
deferring U.S. tax deductions out of, the latter years of the carry-forward
period (e.g., selling appreciated intangible assets, electing straight-line
depreciation); accelerating deductible temporary differences outside the
U.S.; and selling certain assets that produce tax-exempt income, while
purchasing assets that produce fully taxable income. In addition, the sale
or restructuring of certain businesses can produce significant U.S. taxable
income within the relevant carry-forward periods.
