Citibank 2013 Annual Report Download - page 304
Download and view the complete annual report
Please find page 304 of the 2013 Citibank annual report below. You can navigate through the pages in the report by either clicking on the pages listed below, or by using the keyword search tool below to find specific information within the annual report.-
 1
1 -
2
-
3
-
4
-
5
-
6
-
7
-
8
-
9
-
10
-
11
-
12
-
13
-
14
-
15
-
16
-
17
-
18
-
19
-
20
-
21
-
22
-
23
-
24
-
25
-
26
-
27
-
28
-
29
-
30
-
31
-
32
-
33
-
34
-
35
-
36
-
37
-
38
-
39
-
40
-
41
-
42
-
43
-
44
-
45
-
46
-
47
-
48
-
49
-
50
-
51
-
52
-
53
-
54
-
55
-
56
-
57
-
58
-
59
-
60
-
61
-
62
-
63
-
64
-
65
-
66
-
67
-
68
-
69
-
70
-
71
-
72
-
73
-
74
-
75
-
76
-
77
-
78
-
79
-
80
-
81
-
82
-
83
-
84
-
85
-
86
-
87
-
88
-
89
-
90
-
91
-
92
-
93
-
94
-
95
-
96
-
97
-
98
-
99
-
100
-
101
-
102
-
103
-
104
-
105
-
106
-
107
-
108
-
109
-
110
-
111
-
112
-
113
-
114
-
115
-
116
-
117
-
118
-
119
-
120
-
121
-
122
-
123
-
124
-
125
-
126
-
127
-
128
-
129
-
130
-
131
-
132
-
133
-
134
-
135
-
136
-
137
-
138
-
139
-
140
-
141
-
142
-
143
-
144
-
145
-
146
-
147
-
148
-
149
-
150
-
151
-
152
-
153
-
154
-
155
-
156
-
157
-
158
-
159
-
160
-
161
-
162
-
163
-
164
-
165
-
166
-
167
-
168
-
169
-
170
-
171
-
172
-
173
-
174
-
175
-
176
-
177
-
178
-
179
-
180
-
181
-
182
-
183
-
184
-
185
-
186
-
187
-
188
-
189
-
190
-
191
-
192
-
193
-
194
-
195
-
196
-
197
-
198
-
199
-
200
-
201
-
202
-
203
-
204
-
205
-
206
-
207
-
208
-
209
-
210
-
211
-
212
-
213
-
214
-
215
-
216
-
217
-
218
-
219
-
220
-
221
-
222
-
223
-
224
-
225
-
226
-
227
-
228
-
229
-
230
-
231
-
232
-
233
-
234
-
235
-
236
-
237
-
238
-
239
-
240
-
241
-
242
-
243
-
244
-
245
-
246
-
247
-
248
-
249
-
250
-
251
-
252
-
253
-
254
-
255
-
256
-
257
-
258
-
259
-
260
-
261
-
262
-
263
-
264
-
265
-
266
-
267
-
268
-
269
-
270
-
271
-
272
-
273
-
274
-
275
-
276
-
277
-
278
-
279
-
280
-
281
-
282
-
283
-
284
-
285
-
286
-
287
-
288
-
289
-
290
-
291
-
292
-
293
-
 294
294 -
 295
295 -
 296
296 -
 297
297 -
 298
298 -
 299
299 -
 300
300 -
 301
301 -
 302
302 -
 303
303 -
 304
304 -
 305
305 -
 306
306 -
 307
307 -
 308
308 -
 309
309 -
 310
310 -
 311
311 -
 312
312 -
 313
313 -
 314
314 -
315
-
316
-
317
-
318
-
319
-
320
-
321
-
322
-
323
-
324
-
325
-
326
-
327
-
328
-
329
-
330
-
331
-
332
-
333
-
334
-
335
-
336
-
337
-
338
-
339
-
340
-
341
-
342
 |
 |

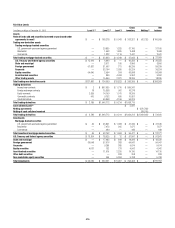
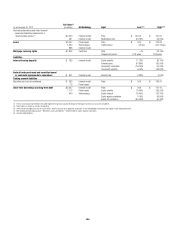
286
As of December 31, 2012
Fair Value
(in millions)
(1)
Methodology Input Low (2)(3) High (2)(3)
Nontrading derivatives and other financial
assets and liabilities measured on a
recurring basis (gross) (4) $ 2,000 External model Price $ 100.00 $ 100.00
461 Internal model Redemption rate 30.79% 99.50%
Loans $ 2,447 Price-based Price $ 0.00 $ 103.32
1,423 Yield analysis Credit spread 55 bps 600.19 bps
888 Internal model
Mortgage servicing rights $ 1,858 Cash flow Yield —% 53.19%
Prepayment period 2.16 years 7.84 years
Liabilities
Interest-bearing deposits $ 785 Internal model Equity volatility 11.13% 86.10%
Forward price 67.80% 182.00%
Commodity correlation (76.00)% 95.00%
Commodity volatility 5.00% 148.00%
Federal funds purchased and securities loaned
or sold under agreements to repurchase $ 841 Internal model Interest rate 0.33% 4.91%
Trading account liabilities
Securities sold, not yet purchased $ 265 Internal model Price $ 0.00 $ 166.47
75 Price-based
Short-term borrowings and long-term debt $ 5,067 Internal model Price $ 0.00 $ 121.16
1,112 Price-based Equity volatility 12.40% 185.20%
649 Yield analysis Equity forward 75.40% 132.70%
Equity-equity correlation 1.00% 99.90%
Equity-FX correlation (80.50)% 50.40%
(1) The fair value amounts presented in this table represent the primary valuation technique or techniques for each class of assets or liabilities.
(2) Some inputs are shown as zero due to rounding.
(3) When the low and high inputs are the same, there is either a constant input applied to all positions, or the methodology involving the input applies to one large position only.
(4) Both trading and nontrading account—derivatives assets and liabilities—are presented on a gross absolute value basis.
(5) Includes hybrid products.