Citibank 2013 Annual Report Download - page 273
Download and view the complete annual report
Please find page 273 of the 2013 Citibank annual report below. You can navigate through the pages in the report by either clicking on the pages listed below, or by using the keyword search tool below to find specific information within the annual report.-
 1
1 -
2
-
3
-
4
-
5
-
6
-
7
-
8
-
9
-
10
-
11
-
12
-
13
-
14
-
15
-
16
-
17
-
18
-
19
-
20
-
21
-
22
-
23
-
24
-
25
-
26
-
27
-
28
-
29
-
30
-
31
-
32
-
33
-
34
-
35
-
36
-
37
-
38
-
39
-
40
-
41
-
42
-
43
-
44
-
45
-
46
-
47
-
48
-
49
-
50
-
51
-
52
-
53
-
54
-
55
-
56
-
57
-
58
-
59
-
60
-
61
-
62
-
63
-
64
-
65
-
66
-
67
-
68
-
69
-
70
-
71
-
72
-
73
-
74
-
75
-
76
-
77
-
78
-
79
-
80
-
81
-
82
-
83
-
84
-
85
-
86
-
87
-
88
-
89
-
90
-
91
-
92
-
93
-
94
-
95
-
96
-
97
-
98
-
99
-
100
-
101
-
102
-
103
-
104
-
105
-
106
-
107
-
108
-
109
-
110
-
111
-
112
-
113
-
114
-
115
-
116
-
117
-
118
-
119
-
120
-
121
-
122
-
123
-
124
-
125
-
126
-
127
-
128
-
129
-
130
-
131
-
132
-
133
-
134
-
135
-
136
-
137
-
138
-
139
-
140
-
141
-
142
-
143
-
144
-
145
-
146
-
147
-
148
-
149
-
150
-
151
-
152
-
153
-
154
-
155
-
156
-
157
-
158
-
159
-
160
-
161
-
162
-
163
-
164
-
165
-
166
-
167
-
168
-
169
-
170
-
171
-
172
-
173
-
174
-
175
-
176
-
177
-
178
-
179
-
180
-
181
-
182
-
183
-
184
-
185
-
186
-
187
-
188
-
189
-
190
-
191
-
192
-
193
-
194
-
195
-
196
-
197
-
198
-
199
-
200
-
201
-
202
-
203
-
204
-
205
-
206
-
207
-
208
-
209
-
210
-
211
-
212
-
213
-
214
-
215
-
216
-
217
-
218
-
219
-
220
-
221
-
222
-
223
-
224
-
225
-
226
-
227
-
228
-
229
-
230
-
231
-
232
-
233
-
234
-
235
-
236
-
237
-
238
-
239
-
240
-
241
-
242
-
243
-
244
-
245
-
246
-
247
-
248
-
249
-
250
-
251
-
252
-
253
-
254
-
255
-
256
-
257
-
258
-
259
-
260
-
261
-
262
-
 263
263 -
 264
264 -
 265
265 -
 266
266 -
 267
267 -
 268
268 -
 269
269 -
 270
270 -
 271
271 -
 272
272 -
 273
273 -
 274
274 -
 275
275 -
 276
276 -
 277
277 -
 278
278 -
 279
279 -
 280
280 -
 281
281 -
 282
282 -
 283
283 -
284
-
285
-
286
-
287
-
288
-
289
-
290
-
291
-
292
-
293
-
294
-
295
-
296
-
297
-
298
-
299
-
300
-
301
-
302
-
303
-
304
-
305
-
306
-
307
-
308
-
309
-
310
-
311
-
312
-
313
-
314
-
315
-
316
-
317
-
318
-
319
-
320
-
321
-
322
-
323
-
324
-
325
-
326
-
327
-
328
-
329
-
330
-
331
-
332
-
333
-
334
-
335
-
336
-
337
-
338
-
339
-
340
-
341
-
342
 |
 |

255
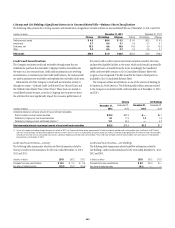
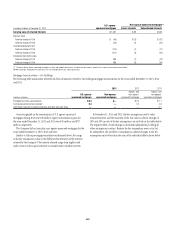
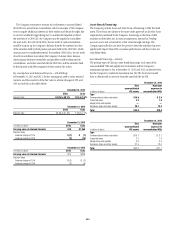
The following table summarizes selected cash flow information related
to asset-based financings for the years ended December 31, 2013, 2012
and 2011:
In billions of dollars 2013 2012 2011
Proceeds from new securitizations $0.5 $— $—
Cash flows received on retained
interest and other net cash flows $0.7 $0.3 $—
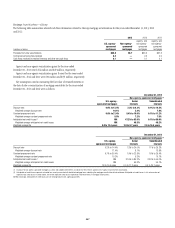
At December 31, 2013 and 2012, the key assumption used to value
retained interests, and the sensitivity of the fair value to adverse changes of
10% and 20% are set forth in the tables below:
December 31, 2013 December 31, 2012
Discount rate 3.0% 3.2%
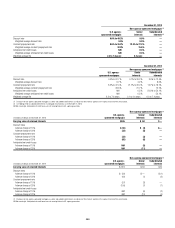
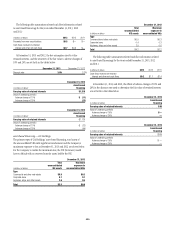
December 31, 2013
In millions of dollars
Asset-based
financing
Carrying value of retained interests $1,316
Value of underlying portfolio
Adverse change of 10% $ (11)
Adverse change of 20% (23)
December 31, 2012
In millions of dollars
Asset-based
financing
Carrying value of retained interests $1,726
Value of underlying portfolio
Adverse change of 10% $ (22)
Adverse change of 20% (44)
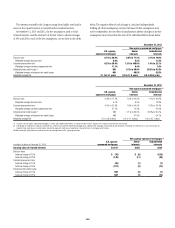
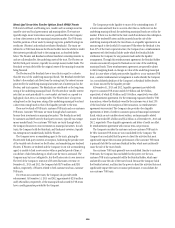
Asset-Based Financing—Citi Holdings
The primary types of Citi Holdings’ asset-based financing, total assets of
the unconsolidated VIEs with significant involvement and the Company’s
maximum exposure to loss at December 31, 2013 and 2012 are shown below.
For the Company to realize the maximum loss, the VIE (borrower) would
have to default with no recovery from the assets held by the VIE.
December 31, 2013
In billions of dollars
Total
unconsolidated
VIE assets
Maximum
exposure to
unconsolidated VIEs
Type
Commercial and other real estate $0.8 $0.3
Corporate loans 0.1 0.1
Airplanes, ships and other assets 2.6 0.5
Total $3.5 $0.9
December 31, 2012
In billions of dollars
Total
unconsolidated
VIE assets
Maximum
exposure to
unconsolidated VIEs
Type
Commercial and other real estate $0.9 $0.3
Corporate loans 0.4 0.3
Airplanes, ships and other assets 2.9 0.6
Total $4.2 $1.2
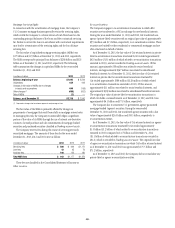
The following table summarizes selected cash flow information related
to asset-based financings for the years ended December 31, 2013, 2012
and 2011:
In billions of dollars 2013 2012 2011
Cash flows received on retained
interest and other net cash flows $0.2 $1.7 $1.4
At December 31, 2013 and 2012, the effects of adverse changes of 10% and
20% in the discount rate used to determine the fair value of retained interests
are set forth in the tables below:
December 31, 2013
In millions of dollars
Asset-based
financing
Carrying value of retained interests $95
Value of underlying portfolio
Adverse change of 10% $—
Adverse change of 20% —
December 31, 2012
In millions of dollars
Asset-based
financing
Carrying value of retained interests $339
Value of underlying portfolio
Adverse change of 10% $ —
Adverse change of 20% —