Citibank 2013 Annual Report Download - page 280
Download and view the complete annual report
Please find page 280 of the 2013 Citibank annual report below. You can navigate through the pages in the report by either clicking on the pages listed below, or by using the keyword search tool below to find specific information within the annual report.-
 1
1 -
2
-
3
-
4
-
5
-
6
-
7
-
8
-
9
-
10
-
11
-
12
-
13
-
14
-
15
-
16
-
17
-
18
-
19
-
20
-
21
-
22
-
23
-
24
-
25
-
26
-
27
-
28
-
29
-
30
-
31
-
32
-
33
-
34
-
35
-
36
-
37
-
38
-
39
-
40
-
41
-
42
-
43
-
44
-
45
-
46
-
47
-
48
-
49
-
50
-
51
-
52
-
53
-
54
-
55
-
56
-
57
-
58
-
59
-
60
-
61
-
62
-
63
-
64
-
65
-
66
-
67
-
68
-
69
-
70
-
71
-
72
-
73
-
74
-
75
-
76
-
77
-
78
-
79
-
80
-
81
-
82
-
83
-
84
-
85
-
86
-
87
-
88
-
89
-
90
-
91
-
92
-
93
-
94
-
95
-
96
-
97
-
98
-
99
-
100
-
101
-
102
-
103
-
104
-
105
-
106
-
107
-
108
-
109
-
110
-
111
-
112
-
113
-
114
-
115
-
116
-
117
-
118
-
119
-
120
-
121
-
122
-
123
-
124
-
125
-
126
-
127
-
128
-
129
-
130
-
131
-
132
-
133
-
134
-
135
-
136
-
137
-
138
-
139
-
140
-
141
-
142
-
143
-
144
-
145
-
146
-
147
-
148
-
149
-
150
-
151
-
152
-
153
-
154
-
155
-
156
-
157
-
158
-
159
-
160
-
161
-
162
-
163
-
164
-
165
-
166
-
167
-
168
-
169
-
170
-
171
-
172
-
173
-
174
-
175
-
176
-
177
-
178
-
179
-
180
-
181
-
182
-
183
-
184
-
185
-
186
-
187
-
188
-
189
-
190
-
191
-
192
-
193
-
194
-
195
-
196
-
197
-
198
-
199
-
200
-
201
-
202
-
203
-
204
-
205
-
206
-
207
-
208
-
209
-
210
-
211
-
212
-
213
-
214
-
215
-
216
-
217
-
218
-
219
-
220
-
221
-
222
-
223
-
224
-
225
-
226
-
227
-
228
-
229
-
230
-
231
-
232
-
233
-
234
-
235
-
236
-
237
-
238
-
239
-
240
-
241
-
242
-
243
-
244
-
245
-
246
-
247
-
248
-
249
-
250
-
251
-
252
-
253
-
254
-
255
-
256
-
257
-
258
-
259
-
260
-
261
-
262
-
263
-
264
-
265
-
266
-
267
-
268
-
269
-
 270
270 -
 271
271 -
 272
272 -
 273
273 -
 274
274 -
 275
275 -
 276
276 -
 277
277 -
 278
278 -
 279
279 -
 280
280 -
 281
281 -
 282
282 -
 283
283 -
 284
284 -
 285
285 -
 286
286 -
 287
287 -
 288
288 -
 289
289 -
 290
290 -
291
-
292
-
293
-
294
-
295
-
296
-
297
-
298
-
299
-
300
-
301
-
302
-
303
-
304
-
305
-
306
-
307
-
308
-
309
-
310
-
311
-
312
-
313
-
314
-
315
-
316
-
317
-
318
-
319
-
320
-
321
-
322
-
323
-
324
-
325
-
326
-
327
-
328
-
329
-
330
-
331
-
332
-
333
-
334
-
335
-
336
-
337
-
338
-
339
-
340
-
341
-
342
 |
 |
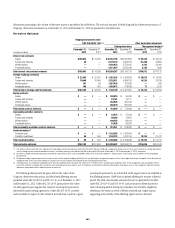
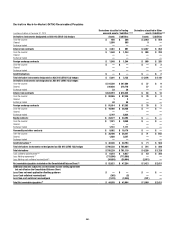
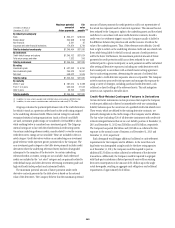
262
(1) The trading derivatives fair values are presented in Note 13 to the Consolidated Financial Statements.
(2) Derivative mark-to-market receivables/payables related to management hedges are recorded in either Other assets/Other liabilities or Trading account assets/Trading account liabilities.
(3) Over-the-counter (OTC) derivatives include derivatives executed and settled bilaterally with counterparties without the use of an organized exchange or central clearing house. Cleared derivatives include derivatives
executed bilaterally with a counterparty in the OTC market but then novated to a central clearing house, whereby the central clearing house becomes the counterparty to both of the original counterparties. Exchange
traded derivatives include derivatives executed directly on an organized exchange that provides pre-trade price transparency.
(4) The credit derivatives trading assets comprise $13,673 million related to protection purchased and $26,673 million related to protection sold as of December 31, 2013. The credit derivatives trading liabilities comprise
$28,158 million related to protection purchased and $12,636 million related to protection sold as of December 31, 2013.
(5) For the trading assets/liabilities, this is the net amount of the $45,167 million and $43,720 million of gross cash collateral paid and received, respectively. Of the gross cash collateral paid, $39,094 million was used to
offset derivative liabilities and, of the gross cash collateral received, $34,893 million was used to offset derivative assets.
(6) For the other assets/liabilities, this is the net amount of the $82 million and $3,233 million of the gross cash collateral paid and received, respectively. Of the gross cash collateral received, $2,951 million was used to
offset derivative assets.
(7) Represents the netting of derivative receivable and payable balances for the same counterparty under enforceable netting agreements. Approximately $394 billion, $315 billion and $5 billion of the netting against
trading account asset/liability balances is attributable to OTC, Cleared and Exchange traded derivatives, respectively.
(8) Represents the netting of cash collateral paid and received by counterparty under enforceable credit support agreements. Substantially all cash collateral received is netted against OTC derivative assets. Cash collateral
paid of approximately $33 billion and $6 billion is netted against OTC and Cleared derivative liabilities, respectively.
(9) The net receivables/payables include approximately $16 billion of both derivative asset and liability fair values not subject to enforceable master netting agreements.