Citibank 2013 Annual Report Download - page 197
Download and view the complete annual report
Please find page 197 of the 2013 Citibank annual report below. You can navigate through the pages in the report by either clicking on the pages listed below, or by using the keyword search tool below to find specific information within the annual report.-
 1
1 -
2
-
3
-
4
-
5
-
6
-
7
-
8
-
9
-
10
-
11
-
12
-
13
-
14
-
15
-
16
-
17
-
18
-
19
-
20
-
21
-
22
-
23
-
24
-
25
-
26
-
27
-
28
-
29
-
30
-
31
-
32
-
33
-
34
-
35
-
36
-
37
-
38
-
39
-
40
-
41
-
42
-
43
-
44
-
45
-
46
-
47
-
48
-
49
-
50
-
51
-
52
-
53
-
54
-
55
-
56
-
57
-
58
-
59
-
60
-
61
-
62
-
63
-
64
-
65
-
66
-
67
-
68
-
69
-
70
-
71
-
72
-
73
-
74
-
75
-
76
-
77
-
78
-
79
-
80
-
81
-
82
-
83
-
84
-
85
-
86
-
87
-
88
-
89
-
90
-
91
-
92
-
93
-
94
-
95
-
96
-
97
-
98
-
99
-
100
-
101
-
102
-
103
-
104
-
105
-
106
-
107
-
108
-
109
-
110
-
111
-
112
-
113
-
114
-
115
-
116
-
117
-
118
-
119
-
120
-
121
-
122
-
123
-
124
-
125
-
126
-
127
-
128
-
129
-
130
-
131
-
132
-
133
-
134
-
135
-
136
-
137
-
138
-
139
-
140
-
141
-
142
-
143
-
144
-
145
-
146
-
147
-
148
-
149
-
150
-
151
-
152
-
153
-
154
-
155
-
156
-
157
-
158
-
159
-
160
-
161
-
162
-
163
-
164
-
165
-
166
-
167
-
168
-
169
-
170
-
171
-
172
-
173
-
174
-
175
-
176
-
177
-
178
-
179
-
180
-
181
-
182
-
183
-
184
-
185
-
186
-
 187
187 -
 188
188 -
 189
189 -
 190
190 -
 191
191 -
 192
192 -
 193
193 -
 194
194 -
 195
195 -
 196
196 -
 197
197 -
 198
198 -
 199
199 -
 200
200 -
 201
201 -
 202
202 -
 203
203 -
 204
204 -
 205
205 -
 206
206 -
 207
207 -
208
-
209
-
210
-
211
-
212
-
213
-
214
-
215
-
216
-
217
-
218
-
219
-
220
-
221
-
222
-
223
-
224
-
225
-
226
-
227
-
228
-
229
-
230
-
231
-
232
-
233
-
234
-
235
-
236
-
237
-
238
-
239
-
240
-
241
-
242
-
243
-
244
-
245
-
246
-
247
-
248
-
249
-
250
-
251
-
252
-
253
-
254
-
255
-
256
-
257
-
258
-
259
-
260
-
261
-
262
-
263
-
264
-
265
-
266
-
267
-
268
-
269
-
270
-
271
-
272
-
273
-
274
-
275
-
276
-
277
-
278
-
279
-
280
-
281
-
282
-
283
-
284
-
285
-
286
-
287
-
288
-
289
-
290
-
291
-
292
-
293
-
294
-
295
-
296
-
297
-
298
-
299
-
300
-
301
-
302
-
303
-
304
-
305
-
306
-
307
-
308
-
309
-
310
-
311
-
312
-
313
-
314
-
315
-
316
-
317
-
318
-
319
-
320
-
321
-
322
-
323
-
324
-
325
-
326
-
327
-
328
-
329
-
330
-
331
-
332
-
333
-
334
-
335
-
336
-
337
-
338
-
339
-
340
-
341
-
342
 |
 |

179
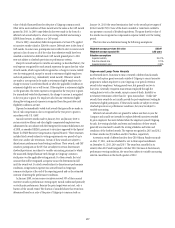
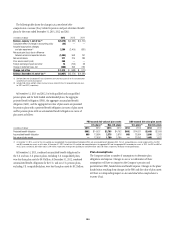
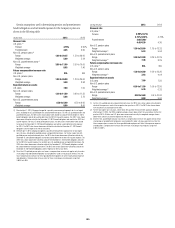
Prior to 2003, Citigroup options had 10-year terms and generally vested
at a rate of 20% per year over five years (with the first vesting date occurring
12 to 18 months following the grant date). All outstanding options that were
granted prior to 2003 expired in 2012.
From 1997 to 2002, a broad base of employees participated in annual
option grant programs. The options vested over five-year periods, or cliff
vested after five years, and had 10-year terms but no reload features. No
grants have been made under these programs since 2002 and all options that
remained outstanding expired in 2012.
All unvested options granted to former CEO Vikram Pandit, including
premium-priced stock options granted on May 17, 2011, were canceled upon
his resignation in October 2012.
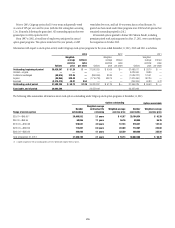
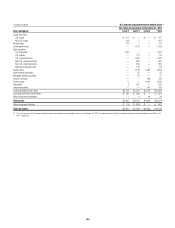
Information with respect to stock option activity under Citigroup stock option programs for the years ended December 31, 2013, 2012 and 2011 is as follows:
2013 2012 2011
Options
Weighted-
average
exercise
price
Intrinsic
value
per share Options
Weighted-
average
exercise
price
Intrinsic
value
per share Options
Weighted-
average
exercise
price
Intrinsic
value
per share
Outstanding, beginning of period 35,020,397 $ 51.20 $ — 37,596,029 $ 69.60 $— 37,486,011 $ 93.70 $ —
Granted—original — — — — — — 3,425,000 48.86 —
Forfeited or exchanged (50,914) 212.35 — (858,906) 83.84 — (1,539,227) 176.41 —
Expired (86,964) 528.40 — (1,716,726) 438.14 — (1,610,450) 487.24 —
Exercised (3,374,413) 40.81 9.54 — — — (165,305) 40.80 6.72
Outstanding, end of period 31,508,106 $ 50.72 $1.39 35,020,397 $ 51.20 $— 37,596,029 $ 69.60 $ —
Exercisable, end of period 30,662,588 32,973,444 23,237,069
The following table summarizes information about stock options outstanding under Citigroup stock option programs at December 31, 2013:
Options outstanding Options exercisable
Range of exercise prices
Number
outstanding
Weighted-average
contractual life
remaining
Weighted-average
exercise price
Number
exercisable
Weighted-average
exercise price
$29.70—$49.99 (1) 30,009,552 2.1 years $ 42.57 29,164,034 $ 42.39
$50.00—$99.99 69,956 7.1 years 56.76 69,956 56.76
$100.00—$199.99 516,531 4.9 years 147.33 516,531 147.33
$200.00—$299.99 712,067 0.8 years 243.80 712,067 243.80
$300.00—$399.99 200,000 4.1 years 335.50 200,000 335.50
Total at December 31, 2013 31,508,106 2.1 years $ 50.73 30,662,588 $ 50.78
(1) A significant portion of the outstanding options are in the $40 to $45 range of exercise prices.