Citibank 2013 Annual Report Download - page 55
Download and view the complete annual report
Please find page 55 of the 2013 Citibank annual report below. You can navigate through the pages in the report by either clicking on the pages listed below, or by using the keyword search tool below to find specific information within the annual report.-
 1
1 -
2
-
3
-
4
-
5
-
6
-
7
-
8
-
9
-
10
-
11
-
12
-
13
-
14
-
15
-
16
-
17
-
18
-
19
-
20
-
21
-
22
-
23
-
24
-
25
-
26
-
27
-
28
-
29
-
30
-
31
-
32
-
33
-
34
-
35
-
36
-
37
-
38
-
39
-
40
-
41
-
42
-
43
-
44
-
 45
45 -
 46
46 -
 47
47 -
 48
48 -
 49
49 -
 50
50 -
 51
51 -
 52
52 -
 53
53 -
 54
54 -
 55
55 -
 56
56 -
 57
57 -
 58
58 -
 59
59 -
 60
60 -
 61
61 -
 62
62 -
 63
63 -
 64
64 -
 65
65 -
66
-
67
-
68
-
69
-
70
-
71
-
72
-
73
-
74
-
75
-
76
-
77
-
78
-
79
-
80
-
81
-
82
-
83
-
84
-
85
-
86
-
87
-
88
-
89
-
90
-
91
-
92
-
93
-
94
-
95
-
96
-
97
-
98
-
99
-
100
-
101
-
102
-
103
-
104
-
105
-
106
-
107
-
108
-
109
-
110
-
111
-
112
-
113
-
114
-
115
-
116
-
117
-
118
-
119
-
120
-
121
-
122
-
123
-
124
-
125
-
126
-
127
-
128
-
129
-
130
-
131
-
132
-
133
-
134
-
135
-
136
-
137
-
138
-
139
-
140
-
141
-
142
-
143
-
144
-
145
-
146
-
147
-
148
-
149
-
150
-
151
-
152
-
153
-
154
-
155
-
156
-
157
-
158
-
159
-
160
-
161
-
162
-
163
-
164
-
165
-
166
-
167
-
168
-
169
-
170
-
171
-
172
-
173
-
174
-
175
-
176
-
177
-
178
-
179
-
180
-
181
-
182
-
183
-
184
-
185
-
186
-
187
-
188
-
189
-
190
-
191
-
192
-
193
-
194
-
195
-
196
-
197
-
198
-
199
-
200
-
201
-
202
-
203
-
204
-
205
-
206
-
207
-
208
-
209
-
210
-
211
-
212
-
213
-
214
-
215
-
216
-
217
-
218
-
219
-
220
-
221
-
222
-
223
-
224
-
225
-
226
-
227
-
228
-
229
-
230
-
231
-
232
-
233
-
234
-
235
-
236
-
237
-
238
-
239
-
240
-
241
-
242
-
243
-
244
-
245
-
246
-
247
-
248
-
249
-
250
-
251
-
252
-
253
-
254
-
255
-
256
-
257
-
258
-
259
-
260
-
261
-
262
-
263
-
264
-
265
-
266
-
267
-
268
-
269
-
270
-
271
-
272
-
273
-
274
-
275
-
276
-
277
-
278
-
279
-
280
-
281
-
282
-
283
-
284
-
285
-
286
-
287
-
288
-
289
-
290
-
291
-
292
-
293
-
294
-
295
-
296
-
297
-
298
-
299
-
300
-
301
-
302
-
303
-
304
-
305
-
306
-
307
-
308
-
309
-
310
-
311
-
312
-
313
-
314
-
315
-
316
-
317
-
318
-
319
-
320
-
321
-
322
-
323
-
324
-
325
-
326
-
327
-
328
-
329
-
330
-
331
-
332
-
333
-
334
-
335
-
336
-
337
-
338
-
339
-
340
-
341
-
342
 |
 |
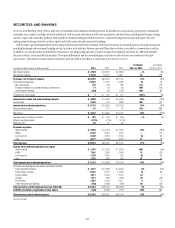
37
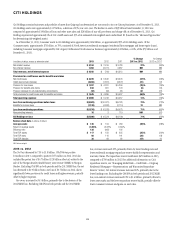
Trading Account Assets
Trading account assets declined during the second half of 2013 due to
declines in client activity in Rates and Currencies in the Markets businesses
within Securities and Banking, as referenced above. Average trading
account assets were $239 billion in the fourth quarter of 2013, compared to
$246 billion in the third quarter of 2013.
For further information on Citi’s trading account assets, see Note 13 to the
Consolidated Financial Statements.
Investments
Investments generally remained stable during 2013, as a slight increase in
foreign government securities was offset by declines in mortgage-backed
securities to reduce the interest rate risk profile and U.S. Treasury and
agency securities.
For further information regarding investments, see Note 14 to the
Consolidated Financial Statements.
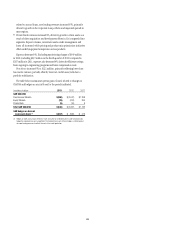
Loans
Loans represent the largest asset category of Citi’s balance sheet. Citi’s
total loans, net of unearned income, were $665 billion at December 31,
2013, compared to $658 billion at September 30, 2013 and $655 billion at
December 31, 2012. The impact of foreign exchange translation reduced loan
balances by $8 billion year-over-year and by $1 billion quarter-over-quarter.
Additionally, approximately $3 billion of loans were moved to Discontinued
operations during the second quarter of 2013 as a result of the agreement to
sell Credicard. Throughout this section, the discussion of loans excludes the
impact of foreign exchange translation, and excludes Credicard loans for the
fourth quarter of 2012 and the third quarter of 2013.
Excluding these items, Citi’s loans increased 3% from the prior-year period
and 1% quarter-over-quarter, as demand from consumer and corporate
customers continued to be supported by the economic recovery, partially
offset by the continued wind down of Citi Holdings. At year-end 2013,
Consumer and Corporate loans represented 59% and 41%, respectively, of
Citi’s total loans.
Citicorp loans increased 8% year-over-year, with growth in both the
Consumer and Corporate loan portfolios. Consumer loans grew 5% from
the prior-year period. In North America, Consumer loans grew 4% from
the prior-year period, primarily reflecting the addition of the approximately
$7 billion of credit card loans as a result of the acquisition of the Best Buy
portfolio in the third quarter of 2013. Internationally, Consumer loans
increased 7% from the prior-year period, led by growth in Mexico, Hong Kong
and India, offset by the ongoing repositioning efforts in Korea.
Corporate loans grew 12% from the prior-year period, with 12% growth
in Asia, 7% growth in EMEA and 17% growth in North America, which
included the consolidation of a $7 billion trade loan portfolio in Transaction
Services during the second quarter of 2013. Private Bank loans increased 14%
year-over-year, with the most significant growth in Asia and North America.
Transaction Services loans grew 16% compared to the prior-year period,
including the trade loan consolidation as well as origination growth in trade
finance throughout the year. Corporate loans, excluding trade loans, grew
10% from the prior-year period.
Citi Holdings loans declined 20% year-over-year, primarily due to
continued run-off and asset sales.
During the fourth quarter of 2013, average loans of $659 billion yielded
an average rate of 7.0%, compared to $645 billion and 7.0% respectively, in
the third quarter of 2013.
For further information on Citi’s loan portfolios, see generally “Managing
Global Risk—Market Risk—Funding and Liquidity” below and Note 15 to
the Consolidated Financial Statements.
Other Assets
Other assets consist of brokerage receivables, goodwill, intangibles and
mortgage servicing rights, in addition to other assets (including, among
other items, loans held-for-sale, deferred tax assets, equity-method
investments, interest and fees receivable, premises and equipment, certain
end-user derivatives in a net receivable position, repossessed assets and
other receivables).
During the fourth quarter of 2013, other assets decreased 2% primarily
due to the sale of Credicard, which was reported in Discontinued operations.
Year-over-year, other assets declined 9% primarily due to a reduction in Citi’s
deferred tax assets and loans held-for-sale as well as FX translation.