Citibank 2013 Annual Report Download - page 65
Download and view the complete annual report
Please find page 65 of the 2013 Citibank annual report below. You can navigate through the pages in the report by either clicking on the pages listed below, or by using the keyword search tool below to find specific information within the annual report.-
 1
1 -
2
-
3
-
4
-
5
-
6
-
7
-
8
-
9
-
10
-
11
-
12
-
13
-
14
-
15
-
16
-
17
-
18
-
19
-
20
-
21
-
22
-
23
-
24
-
25
-
26
-
27
-
28
-
29
-
30
-
31
-
32
-
33
-
34
-
35
-
36
-
37
-
38
-
39
-
40
-
41
-
42
-
43
-
44
-
45
-
46
-
47
-
48
-
49
-
50
-
51
-
52
-
53
-
54
-
 55
55 -
 56
56 -
 57
57 -
 58
58 -
 59
59 -
 60
60 -
 61
61 -
 62
62 -
 63
63 -
 64
64 -
 65
65 -
 66
66 -
 67
67 -
 68
68 -
 69
69 -
 70
70 -
 71
71 -
 72
72 -
 73
73 -
 74
74 -
 75
75 -
76
-
77
-
78
-
79
-
80
-
81
-
82
-
83
-
84
-
85
-
86
-
87
-
88
-
89
-
90
-
91
-
92
-
93
-
94
-
95
-
96
-
97
-
98
-
99
-
100
-
101
-
102
-
103
-
104
-
105
-
106
-
107
-
108
-
109
-
110
-
111
-
112
-
113
-
114
-
115
-
116
-
117
-
118
-
119
-
120
-
121
-
122
-
123
-
124
-
125
-
126
-
127
-
128
-
129
-
130
-
131
-
132
-
133
-
134
-
135
-
136
-
137
-
138
-
139
-
140
-
141
-
142
-
143
-
144
-
145
-
146
-
147
-
148
-
149
-
150
-
151
-
152
-
153
-
154
-
155
-
156
-
157
-
158
-
159
-
160
-
161
-
162
-
163
-
164
-
165
-
166
-
167
-
168
-
169
-
170
-
171
-
172
-
173
-
174
-
175
-
176
-
177
-
178
-
179
-
180
-
181
-
182
-
183
-
184
-
185
-
186
-
187
-
188
-
189
-
190
-
191
-
192
-
193
-
194
-
195
-
196
-
197
-
198
-
199
-
200
-
201
-
202
-
203
-
204
-
205
-
206
-
207
-
208
-
209
-
210
-
211
-
212
-
213
-
214
-
215
-
216
-
217
-
218
-
219
-
220
-
221
-
222
-
223
-
224
-
225
-
226
-
227
-
228
-
229
-
230
-
231
-
232
-
233
-
234
-
235
-
236
-
237
-
238
-
239
-
240
-
241
-
242
-
243
-
244
-
245
-
246
-
247
-
248
-
249
-
250
-
251
-
252
-
253
-
254
-
255
-
256
-
257
-
258
-
259
-
260
-
261
-
262
-
263
-
264
-
265
-
266
-
267
-
268
-
269
-
270
-
271
-
272
-
273
-
274
-
275
-
276
-
277
-
278
-
279
-
280
-
281
-
282
-
283
-
284
-
285
-
286
-
287
-
288
-
289
-
290
-
291
-
292
-
293
-
294
-
295
-
296
-
297
-
298
-
299
-
300
-
301
-
302
-
303
-
304
-
305
-
306
-
307
-
308
-
309
-
310
-
311
-
312
-
313
-
314
-
315
-
316
-
317
-
318
-
319
-
320
-
321
-
322
-
323
-
324
-
325
-
326
-
327
-
328
-
329
-
330
-
331
-
332
-
333
-
334
-
335
-
336
-
337
-
338
-
339
-
340
-
341
-
342
 |
 |

47
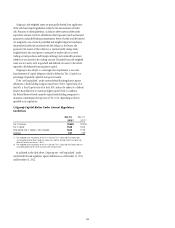
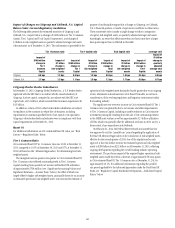
Impact of Changes on Citigroup and Citibank, N.A. Capital
Ratios Under Current Regulatory Guidelines
The following table presents the estimated sensitivity of Citigroup’s and
Citibank, N.A.’s capital ratios to changes of $100 million in Tier 1 Common
Capital, Tier 1 Capital and Total Capital (numerator), and changes of
$1 billion in risk-weighted assets or quarterly adjusted average total assets
(denominator) as of December 31, 2013. This information is provided for the
purpose of analyzing the impact that a change in Citigroup’s or Citibank,
N.A.’s financial position or results of operations could have on these ratios.
These sensitivities only consider a single change to either a component
of capital, risk-weighted assets, or quarterly adjusted average total assets.
Accordingly, an event that affects more than one factor may have a larger
basis point impact than is reflected in this table.
Tier 1 Common ratio Tier 1 Capital ratio Total Capital ratio Leverage ratio
Impact of
$100 million
change in
Tier 1
Common
Capital
Impact of
$1 billion
change in
risk-weighted
assets
Impact of
$100 million
change in
Tier 1
Capital
Impact of
$1 billion
change in
risk-weighted
assets
Impact of
$100 million
change in
Total
Capital
Impact of
$1 billion
change in
risk-weighted
assets
Impact of
$100 million
change in
Tier 1
Capital
Impact of
$1 billion
change in
quarterly
adjusted
average total
assets
Citigroup 0.9 bps 1.2 bps 0.9 bps 1.3 bps 0.9 bps 1.5 bps 0.5 bps 0.5 bps
Citibank, N.A. 1.1 bps 1.5 bps 1.1 bps 1.5 bps 1.1 bps 1.7 bps 0.8 bps 0.7 bps
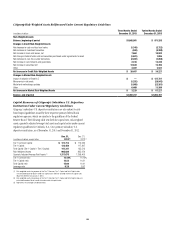
Citigroup Broker-Dealer Subsidiaries
At December 31, 2013, Citigroup Global Markets Inc., a U.S. broker-dealer
registered with the SEC that is an indirect wholly owned subsidiary of
Citigroup, had net capital, computed in accordance with the SEC’s net
capital rule, of $5.4 billion, which exceeded the minimum requirement by
$4.5 billion.
In addition, certain of Citi’s other broker-dealer subsidiaries are subject
to regulation in the countries in which they do business, including
requirements to maintain specified levels of net capital or its equivalent.
Citigroup’s other broker-dealer subsidiaries were in compliance with their
capital requirements at December 31, 2013.
Basel III
For additional information on Citi’s estimated Basel III ratios, see “Risk
Factors—Regulatory Risks” below.
Tier 1 Common Ratio
Citi’s estimated Basel III Tier 1 Common ratio was 10.6% at December 31,
2013, compared to 10.5% at September 30, 2013 and 8.7% at December 31,
2012 (all based on the “Advanced Approaches” for determining total risk-
weighted assets).
The marginal increase quarter-over-quarter in Citi’s estimated Basel III
Tier 1 Common ratio reflected continued growth in Tier 1 Common
Capital resulting from quarterly net income and further DTA utilization
of approximately $700 million (see “Significant Accounting Policies and
Significant Estimates—Income Taxes” below), the effect of which was
largely offset by higher risk-weighted assets, principally driven by an increase
in estimated operational risk-weighted assets. Citi increased its estimate of
operational risk-weighted assets during the fourth quarter due to an ongoing
review, refinement and enhancement of its Basel III models, as well as in
consideration of the evolving regulatory and litigation environment within
the banking industry.
The significant year-over-year increase in Citi’s estimated Basel III Tier 1
Common ratio was primarily due to net income and other improvements
to Tier 1 Common Capital, including a sizable reduction in Citi’s minority
investments principally resulting from the sale of Citi’s remaining interest
in the MSSB joint venture as well as approximately $2.5 billion utilization
of DTAs, which was partially offset by additional net losses in AOCI and, to a
lesser extent, share repurchases and dividends.
On February 21, 2014, the Federal Reserve Board announced that Citi
was approved to exit the “parallel run” period regarding the application of
the Basel III Advanced Approaches in the calculation of risk-weighted assets,
effective for the second quarter of 2014. One of the stipulations for such
approval is that Citi further increase its estimated operational risk-weighted
assets to $288 billion from $232 billion as of December 31, 2013, reflecting
ongoing developments regarding the overall banking industry operating
environment. The pro forma impact of the required higher operational risk-
weighted assets would have been a decrease of approximately 50 basis points
in Citi’s estimated Basel III Tier 1 Common ratio at December 31, 2013 to
approximately 10.1%. For additional information regarding the parallel
run period applicable to the Advanced Approaches under the Final Basel III
Rules, see “Regulatory Capital Standards Developments—Risk-Based Capital
Ratios” below.