Citibank 2013 Annual Report Download - page 50
Download and view the complete annual report
Please find page 50 of the 2013 Citibank annual report below. You can navigate through the pages in the report by either clicking on the pages listed below, or by using the keyword search tool below to find specific information within the annual report.-
 1
1 -
2
-
3
-
4
-
5
-
6
-
7
-
8
-
9
-
10
-
11
-
12
-
13
-
14
-
15
-
16
-
17
-
18
-
19
-
20
-
21
-
22
-
23
-
24
-
25
-
26
-
27
-
28
-
29
-
30
-
31
-
32
-
33
-
34
-
35
-
36
-
37
-
38
-
39
-
 40
40 -
 41
41 -
 42
42 -
 43
43 -
 44
44 -
 45
45 -
 46
46 -
 47
47 -
 48
48 -
 49
49 -
 50
50 -
 51
51 -
 52
52 -
 53
53 -
 54
54 -
 55
55 -
 56
56 -
 57
57 -
 58
58 -
 59
59 -
 60
60 -
61
-
62
-
63
-
64
-
65
-
66
-
67
-
68
-
69
-
70
-
71
-
72
-
73
-
74
-
75
-
76
-
77
-
78
-
79
-
80
-
81
-
82
-
83
-
84
-
85
-
86
-
87
-
88
-
89
-
90
-
91
-
92
-
93
-
94
-
95
-
96
-
97
-
98
-
99
-
100
-
101
-
102
-
103
-
104
-
105
-
106
-
107
-
108
-
109
-
110
-
111
-
112
-
113
-
114
-
115
-
116
-
117
-
118
-
119
-
120
-
121
-
122
-
123
-
124
-
125
-
126
-
127
-
128
-
129
-
130
-
131
-
132
-
133
-
134
-
135
-
136
-
137
-
138
-
139
-
140
-
141
-
142
-
143
-
144
-
145
-
146
-
147
-
148
-
149
-
150
-
151
-
152
-
153
-
154
-
155
-
156
-
157
-
158
-
159
-
160
-
161
-
162
-
163
-
164
-
165
-
166
-
167
-
168
-
169
-
170
-
171
-
172
-
173
-
174
-
175
-
176
-
177
-
178
-
179
-
180
-
181
-
182
-
183
-
184
-
185
-
186
-
187
-
188
-
189
-
190
-
191
-
192
-
193
-
194
-
195
-
196
-
197
-
198
-
199
-
200
-
201
-
202
-
203
-
204
-
205
-
206
-
207
-
208
-
209
-
210
-
211
-
212
-
213
-
214
-
215
-
216
-
217
-
218
-
219
-
220
-
221
-
222
-
223
-
224
-
225
-
226
-
227
-
228
-
229
-
230
-
231
-
232
-
233
-
234
-
235
-
236
-
237
-
238
-
239
-
240
-
241
-
242
-
243
-
244
-
245
-
246
-
247
-
248
-
249
-
250
-
251
-
252
-
253
-
254
-
255
-
256
-
257
-
258
-
259
-
260
-
261
-
262
-
263
-
264
-
265
-
266
-
267
-
268
-
269
-
270
-
271
-
272
-
273
-
274
-
275
-
276
-
277
-
278
-
279
-
280
-
281
-
282
-
283
-
284
-
285
-
286
-
287
-
288
-
289
-
290
-
291
-
292
-
293
-
294
-
295
-
296
-
297
-
298
-
299
-
300
-
301
-
302
-
303
-
304
-
305
-
306
-
307
-
308
-
309
-
310
-
311
-
312
-
313
-
314
-
315
-
316
-
317
-
318
-
319
-
320
-
321
-
322
-
323
-
324
-
325
-
326
-
327
-
328
-
329
-
330
-
331
-
332
-
333
-
334
-
335
-
336
-
337
-
338
-
339
-
340
-
341
-
342
 |
 |

32
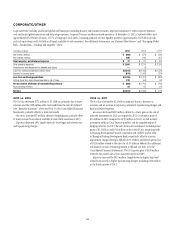
CORPORATE/OTHER
Corporate/Other includes unallocated global staff functions (including finance, risk, human resources, legal and compliance), other corporate expenses
and unallocated global operations and technology expenses, Corporate Treasury and discontinued operations. At December 31, 2013, Corporate/Other had
approximately $313 billion of assets, or 17% of Citigroup’s total assets, consisting primarily of Citi’s liquidity portfolio (approximately $117 billion of cash
and cash equivalents and $143 billion of liquid available-for-sale securities). For additional information, see “Balance Sheet Review” and “Managing Global
Risk—Market Risk—Funding and Liquidity” below.
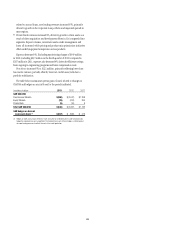
In millions of dollars 2013 2012 2011
Net interest revenue $ (609) $(576) $ (190)
Non-interest revenue 686 646 952
Total revenues, net of interest expense $ 77 $ 70 $ 762
Total operating expenses $ 1,950 $ 3,216 $ 2,293
Provisions for loan losses and for benefits and claims —(1) 1
Loss from continuing operations before taxes $(1,873) $(3,145) $(1,532)
Benefits for income taxes (614) (1,443) (724)
Loss from continuing operations $(1,259) $(1,702) $ (808)
Income (loss) from discontinued operations, net of taxes 270 (58) 68
Net loss before attribution of noncontrolling interests $ (989) $(1,760) $ (740)
Noncontrolling interests 84 85 (27)
Net loss $(1,073) $(1,845) $ (713)
2013 vs. 2012
The Net loss decreased $772 million to $1.1 billion, primarily due to lower
expenses and the $189 million after-tax benefit from the sale of Credicard
(see “Executive Summary” above and Note 2 to the Consolidated Financial
Statements), partially offset by a lower tax benefit.
Revenues increased $7 million, driven by hedging gains, partially offset
by lower revenue from sales of available-for-sale (AFS) securities in 2013.
Expenses decreased 39%, largely driven by lower legal and related costs
and repositioning charges.
2012 vs. 2011
The Net loss increased by $1.1 billion, primarily due to a decrease in
revenues and an increase in expenses, particularly repositioning charges and
legal and related expenses.
Revenues decreased $692 million, driven by a lower gain on the sale of
minority investments in 2012 as compared to 2011 (a net pretax gain of
$54 million in 2012 compared to $199 million in 2011), as well as lower
investment yields on Citi’s Treasury portfolio and the negative impact of
hedging activities. In 2012, the sale of minority investments included pretax
gains of $1.1 billion and $542 million on the sales of Citi’s remaining stake
in Housing Development Finance Corporation Ltd. (HDFC) and its stake
in Shanghai Pudong Development Bank, respectively, offset by a pretax
impairment charge relating to Akbank of $1.2 billion and the net pretax loss
of $424 million related to the sale of a 10.1% stake in Akbank (for additional
information on Citi’s remaining interest in Akbank, see Note 14 to the
Consolidated Financial Statements). The 2011 pretax gain of $199 million
related to the partial sale of Citi’s minority interest in HDFC.
Expenses increased by $923 million, largely driven by higher legal and
related costs as well as higher repositioning charges, including $253 million
in the fourth quarter of 2012.