Citibank 2013 Annual Report Download - page 298
Download and view the complete annual report
Please find page 298 of the 2013 Citibank annual report below. You can navigate through the pages in the report by either clicking on the pages listed below, or by using the keyword search tool below to find specific information within the annual report.-
 1
1 -
2
-
3
-
4
-
5
-
6
-
7
-
8
-
9
-
10
-
11
-
12
-
13
-
14
-
15
-
16
-
17
-
18
-
19
-
20
-
21
-
22
-
23
-
24
-
25
-
26
-
27
-
28
-
29
-
30
-
31
-
32
-
33
-
34
-
35
-
36
-
37
-
38
-
39
-
40
-
41
-
42
-
43
-
44
-
45
-
46
-
47
-
48
-
49
-
50
-
51
-
52
-
53
-
54
-
55
-
56
-
57
-
58
-
59
-
60
-
61
-
62
-
63
-
64
-
65
-
66
-
67
-
68
-
69
-
70
-
71
-
72
-
73
-
74
-
75
-
76
-
77
-
78
-
79
-
80
-
81
-
82
-
83
-
84
-
85
-
86
-
87
-
88
-
89
-
90
-
91
-
92
-
93
-
94
-
95
-
96
-
97
-
98
-
99
-
100
-
101
-
102
-
103
-
104
-
105
-
106
-
107
-
108
-
109
-
110
-
111
-
112
-
113
-
114
-
115
-
116
-
117
-
118
-
119
-
120
-
121
-
122
-
123
-
124
-
125
-
126
-
127
-
128
-
129
-
130
-
131
-
132
-
133
-
134
-
135
-
136
-
137
-
138
-
139
-
140
-
141
-
142
-
143
-
144
-
145
-
146
-
147
-
148
-
149
-
150
-
151
-
152
-
153
-
154
-
155
-
156
-
157
-
158
-
159
-
160
-
161
-
162
-
163
-
164
-
165
-
166
-
167
-
168
-
169
-
170
-
171
-
172
-
173
-
174
-
175
-
176
-
177
-
178
-
179
-
180
-
181
-
182
-
183
-
184
-
185
-
186
-
187
-
188
-
189
-
190
-
191
-
192
-
193
-
194
-
195
-
196
-
197
-
198
-
199
-
200
-
201
-
202
-
203
-
204
-
205
-
206
-
207
-
208
-
209
-
210
-
211
-
212
-
213
-
214
-
215
-
216
-
217
-
218
-
219
-
220
-
221
-
222
-
223
-
224
-
225
-
226
-
227
-
228
-
229
-
230
-
231
-
232
-
233
-
234
-
235
-
236
-
237
-
238
-
239
-
240
-
241
-
242
-
243
-
244
-
245
-
246
-
247
-
248
-
249
-
250
-
251
-
252
-
253
-
254
-
255
-
256
-
257
-
258
-
259
-
260
-
261
-
262
-
263
-
264
-
265
-
266
-
267
-
268
-
269
-
270
-
271
-
272
-
273
-
274
-
275
-
276
-
277
-
278
-
279
-
280
-
281
-
282
-
283
-
284
-
285
-
286
-
287
-
 288
288 -
 289
289 -
 290
290 -
 291
291 -
 292
292 -
 293
293 -
 294
294 -
 295
295 -
 296
296 -
 297
297 -
 298
298 -
 299
299 -
 300
300 -
 301
301 -
 302
302 -
 303
303 -
 304
304 -
 305
305 -
 306
306 -
 307
307 -
 308
308 -
309
-
310
-
311
-
312
-
313
-
314
-
315
-
316
-
317
-
318
-
319
-
320
-
321
-
322
-
323
-
324
-
325
-
326
-
327
-
328
-
329
-
330
-
331
-
332
-
333
-
334
-
335
-
336
-
337
-
338
-
339
-
340
-
341
-
342
 |
 |

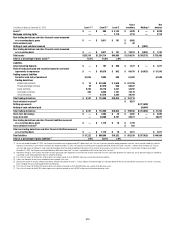
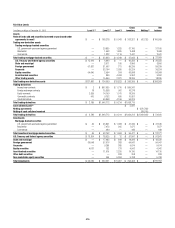
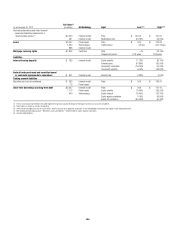
280
In millions of dollars
Dec. 31,
2011
Net realized/unrealized
gains (losses) incl. in Transfers
Purchases Issuances Sales Settlements
Dec. 31,
2012
Unrealized
gains
(losses)
still held (3)
Principal
transactions Other (1)(2)
into
Level 3
out of
Level 3
Assets
Federal funds sold and securities
borrowed or purchased under
agreements to resell $ 4,701 $ 306 $ — $ 540 $ (444) $ — $ — $ — $ (60) $ 5,043 $ 317
Trading non-derivative assets
Trading mortgage-backed
securities
U.S. government-sponsored agency
guaranteed $ 861 $ 38 $ — $ 1,294 $ (735) $ 657 $ 79 $ (735) $ (134) $ 1,325 $ (16)
Residential 1,509 204 — 848 (499) 1,652 — (1,897) (12) 1,805 (27)
Commercial 618 (32) — 327 (305) 1,056 — (545) — 1,119 28
Total trading mortgage-backed
securities $ 2,988 $ 210 $ — $ 2,469 $(1,539) $ 3,365 $ 79 $ (3,177) $ (146) $ 4,249 $ (15)
U.S. Treasury and federal agency
securities $ 3 $ — $ — $ — $ — $ 13 $ — $ (16) $ — $ — $ —
State and municipal 252 24 — 19 (18) 61 — (143) — 195 (2)
Foreign government 521 25 — 89 (875) 960 — (409) — 311 5
Corporate 3,240 (90) — 464 (558) 2,622 — (1,942) (1,706) 2,030 (28)
Equity securities 244 (25) — 121 (47) 231 — (192) (68) 264 (5)
Asset-backed securities 5,801 503 — 222 (114) 6,873 — (7,823) (1,009) 4,453 (173)
Other trading assets 2,743 (8) — 1,126 (2,089) 2,954 — (2,092) (313) 2,321 376
Total trading non-derivative assets $15,792 $ 639 $ — $ 4,510 $(5,240) $17,079 $ 79 $(15,794) $(3,242) $13,823 $ 158
Trading derivatives, net (4)
Interest rate contracts 726 (101) — 682 (438) 311 — (194) (805) 181 (298)
Foreign exchange contracts (562) 440 — (1) 25 196 — (213) 115 — (190)
Equity contracts (1,737) 326 — (34) 443 428 — (657) (217) (1,448) (506)
Commodity contracts (934) 145 — (66) 5 100 — (89) 68 (771) 114
Credit derivatives 1,728 (2,355) — 32 (188) 117 — (11) 335 (342) (692)
Total trading derivatives, net (4) $ (779) $(1,545) $ — $ 613 $ (153) $ 1,152 $ — $ (1,164) $ (504) $ (2,380) $(1,572)
Investments
Mortgage-backed securities
U.S. government-sponsored agency
guaranteed $ 679 $ — $ 7 $ 894 $(3,742) $ 3,622 $ — $ — $ (2) $ 1,458 $ 43
Residential 8 — 6 205 (6) 46 — (54) — 205 —
Commercial — — — — (11) 11 — — — — —
Total investment mortgage-
backed securities $ 687 $ — $ 13 $ 1,099 $(3,759) $ 3,679 $ — $ (54) $ (2) $ 1,663 $ 43
U.S. Treasury and federal agency
securities $ 75 $ — $ — $ 75 $ (150) $ 12 $ — $ — $ — $ 12 $ —
State and municipal 667 — 12 129 (153) 412 — (218) — 849 (20)
Foreign government 447 — 20 193 (297) 519 — (387) (112) 383 1
Corporate 989 — (6) 68 (698) 224 — (144) (48) 385 8
Equity securities 1,453 — 119 — — — — (308) (491) 773 (34)
Asset-backed securities 4,041 — (98) — (730) 930 — (77) (1,846) 2,220 1
Other debt securities 120 — (53) — — 310 — (118) (1) 258 —
Non-marketable equity securities 8,318 — 453 — — 1,266 — (3,373) (1,300) 5,364 313
Total investments $16,797 $ — $ 460 $ 1,564 $ (5,787) $ 7,352 $ — $ (4,679) $ (3,800) $11,907 $ 312