Citibank 2013 Annual Report Download - page 52
Download and view the complete annual report
Please find page 52 of the 2013 Citibank annual report below. You can navigate through the pages in the report by either clicking on the pages listed below, or by using the keyword search tool below to find specific information within the annual report.-
 1
1 -
2
-
3
-
4
-
5
-
6
-
7
-
8
-
9
-
10
-
11
-
12
-
13
-
14
-
15
-
16
-
17
-
18
-
19
-
20
-
21
-
22
-
23
-
24
-
25
-
26
-
27
-
28
-
29
-
30
-
31
-
32
-
33
-
34
-
35
-
36
-
37
-
38
-
39
-
40
-
41
-
 42
42 -
 43
43 -
 44
44 -
 45
45 -
 46
46 -
 47
47 -
 48
48 -
 49
49 -
 50
50 -
 51
51 -
 52
52 -
 53
53 -
 54
54 -
 55
55 -
 56
56 -
 57
57 -
 58
58 -
 59
59 -
 60
60 -
 61
61 -
 62
62 -
63
-
64
-
65
-
66
-
67
-
68
-
69
-
70
-
71
-
72
-
73
-
74
-
75
-
76
-
77
-
78
-
79
-
80
-
81
-
82
-
83
-
84
-
85
-
86
-
87
-
88
-
89
-
90
-
91
-
92
-
93
-
94
-
95
-
96
-
97
-
98
-
99
-
100
-
101
-
102
-
103
-
104
-
105
-
106
-
107
-
108
-
109
-
110
-
111
-
112
-
113
-
114
-
115
-
116
-
117
-
118
-
119
-
120
-
121
-
122
-
123
-
124
-
125
-
126
-
127
-
128
-
129
-
130
-
131
-
132
-
133
-
134
-
135
-
136
-
137
-
138
-
139
-
140
-
141
-
142
-
143
-
144
-
145
-
146
-
147
-
148
-
149
-
150
-
151
-
152
-
153
-
154
-
155
-
156
-
157
-
158
-
159
-
160
-
161
-
162
-
163
-
164
-
165
-
166
-
167
-
168
-
169
-
170
-
171
-
172
-
173
-
174
-
175
-
176
-
177
-
178
-
179
-
180
-
181
-
182
-
183
-
184
-
185
-
186
-
187
-
188
-
189
-
190
-
191
-
192
-
193
-
194
-
195
-
196
-
197
-
198
-
199
-
200
-
201
-
202
-
203
-
204
-
205
-
206
-
207
-
208
-
209
-
210
-
211
-
212
-
213
-
214
-
215
-
216
-
217
-
218
-
219
-
220
-
221
-
222
-
223
-
224
-
225
-
226
-
227
-
228
-
229
-
230
-
231
-
232
-
233
-
234
-
235
-
236
-
237
-
238
-
239
-
240
-
241
-
242
-
243
-
244
-
245
-
246
-
247
-
248
-
249
-
250
-
251
-
252
-
253
-
254
-
255
-
256
-
257
-
258
-
259
-
260
-
261
-
262
-
263
-
264
-
265
-
266
-
267
-
268
-
269
-
270
-
271
-
272
-
273
-
274
-
275
-
276
-
277
-
278
-
279
-
280
-
281
-
282
-
283
-
284
-
285
-
286
-
287
-
288
-
289
-
290
-
291
-
292
-
293
-
294
-
295
-
296
-
297
-
298
-
299
-
300
-
301
-
302
-
303
-
304
-
305
-
306
-
307
-
308
-
309
-
310
-
311
-
312
-
313
-
314
-
315
-
316
-
317
-
318
-
319
-
320
-
321
-
322
-
323
-
324
-
325
-
326
-
327
-
328
-
329
-
330
-
331
-
332
-
333
-
334
-
335
-
336
-
337
-
338
-
339
-
340
-
341
-
342
 |
 |
34
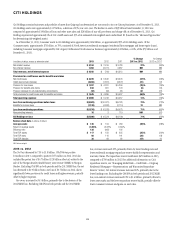
Expenses increased 13%, primarily due to higher legal and related costs
($2.6 billion in 2013 compared to $1.2 billion in 2012), driven largely
by legacy private-label securitization and other mortgage-related issues,
partially offset by lower overall assets. Excluding legal and related costs,
expenses declined 19% versus 2012. During 2013, approximately one-third
of Citi Holdings’ expenses, excluding legal and related costs, consisted of
mortgage-related expenses. Citi expects that the sale of mortgage servicing
rights (MSRs) announced in January 2014 should benefit mortgage expenses
in Citi Holdings during 2014 (see “Managing Global Risk—Credit Risk—
Mortgage Servicing Rights” below). While Citi may seek to execute similar
sales in the future, such sales often require investor and other approvals and
could also be subject to regulatory review.
Provisions decreased 66%, driven by the absence of incremental net credit
losses relating to the national mortgage settlement and those required by
OCC guidance during 2012 (see discussion below), as well as improved credit
in North America mortgages and overall lower asset levels.
Loan loss reserve releases increased 31% to $2 billion, which included a
loan loss reserve release of approximately $2.2 billion related to the North
America mortgage portfolio, partially offset by losses on asset sales. Loan
loss reserves related to the North America mortgage portfolio were utilized
to offset a substantial portion of the North America mortgage portfolio net
credit losses during 2013.
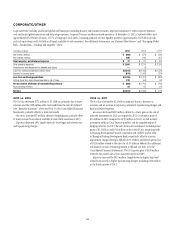
2012 vs. 2011
The Net loss increased by 56% to $6.5 billion, primarily due to the 2012
MSSB loss. CVA/DVA was positive $157 million, compared to positive
$74 million in 2011. Excluding CVA/DVA in both periods and the 2012
MSSB loss, the net loss decreased to $3.7 billion compared to a net loss of
$4.2 billion in 2011, as lower revenues were partially offset by lower expenses,
lower provisions and a tax benefit on the sale of a business in 2012.
Revenues decreased $7.1 billion to negative $792 million, primarily due
to the 2012 MSSB loss. Excluding CVA/DVA in both periods and the 2012
MSSB loss, revenues decreased 40%, primarily due to lower loan balances
driven by continued asset sales, divestitures and run-off and higher funding
costs related to MSSB assets, the absence of private equity marks and lower
gains on sales.
Expenses decreased 19%, driven by lower volumes and divestitures and
slightly lower legal and related costs.
Provisions decreased 19%, driven primarily by improved credit in
North America mortgages and lower volumes and divestitures, partially
offset by lower loan loss reserve releases. Net credit losses decreased by
32% to $5.8 billion, primarily reflecting improvements in North America
mortgages and despite being impacted by incremental mortgage charge-offs
of approximately $635 million required by OCC guidance regarding the
treatment of mortgage loans where the borrower has gone through Chapter 7
bankruptcy and approximately $370 million related to previously deferred
principal balances on modified mortgages related to anticipated forgiveness
of principal in connection with the national mortgage settlement. In
addition, net credit losses in 2012 were negatively impacted by an additional
aggregate amount of $146 million related to the national mortgage
settlement (see “Managing Global Risk—Credit Risk—National Mortgage
Settlement” below).
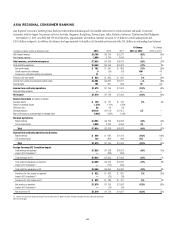
Japan Consumer Finance
In 2008, Citi decided to exit its Japan Consumer Finance business and has
liquidated approximately 92% of the portfolio since that time. While the
portfolio has been significantly reduced, Citi continues to monitor various
aspects of this legacy business relating to the charging of “gray zone”
interest, including customer defaults, refund claims and litigation, as well as
financial, legislative, regulatory, judicial and other political developments.
Gray zone interest represents interest at rates that are legal but for which
claims may not be enforceable.
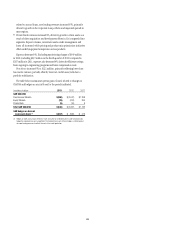
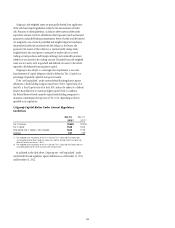
As of December 31, 2013, Citi’s Japan Consumer Finance business had
approximately $278 million in outstanding loans that currently charge
or have previously charged interest rates in the gray zone, compared to
approximately $709 million as of December 31, 2012. However, Citi could
also be subject to refund claims on previously outstanding loans that charged
gray zone interest and thus could be subject to losses on loans in excess of
these amounts.
At December 31, 2013, Citi’s reserves related to customer refunds in
the Japan Consumer Finance business were $434 million, compared to
$736 million at December 31, 2012. The decrease in the reserve year-over-
year primarily resulted from the significant liquidation of the portfolio,
payments made to customers and a continuing reduction in the population
of current and former customers who are eligible to make refund claims.
Citi continues to monitor and evaluate developments relating to the
charging of gray zone interest and the potential impact to both currently and
previously outstanding loans in this legacy business as well as its reserves
related thereto. The potential amount of losses and their impact on Citi is
subject to significant uncertainty and continues to be difficult to predict.
Payment Protection Insurance (PPI)
The alleged mis-selling of PPI by financial institutions in the U.K. has
been, and continues to be, the subject of intense review and focus by U.K.
regulators, particularly the Financial Conduct Authority (FCA) (formerly the
Financial Services Authority). The FCA has found certain problems across
the industry with how these products were sold, including customers not
realizing that the cost of PPI premiums was being added to their loan or PPI
being unsuitable for the customer.
PPI is designed to cover a customer’s loan repayments if certain events
occur, such as long-term illness or unemployment. Prior to 2008, certain
of Citi’s legacy U.K. consumer finance businesses, primarily CitiFinancial
Europe plc and Canada Square Operations Ltd (formerly Egg Banking plc),
engaged in the sale of PPI. While Citi has sold a significant portion of these
businesses, and the remaining businesses are in the process of wind down,
Citi generally remains subject to customer complaints for, and retains the
potential liability relating to, the sale of PPI by these businesses.
In 2011, the FCA required all firms engaged in the sale of PPI in the
U.K. to review their historical sales processes for PPI. In addition, the FCA