Citibank 2013 Annual Report Download - page 268
Download and view the complete annual report
Please find page 268 of the 2013 Citibank annual report below. You can navigate through the pages in the report by either clicking on the pages listed below, or by using the keyword search tool below to find specific information within the annual report.-
 1
1 -
2
-
3
-
4
-
5
-
6
-
7
-
8
-
9
-
10
-
11
-
12
-
13
-
14
-
15
-
16
-
17
-
18
-
19
-
20
-
21
-
22
-
23
-
24
-
25
-
26
-
27
-
28
-
29
-
30
-
31
-
32
-
33
-
34
-
35
-
36
-
37
-
38
-
39
-
40
-
41
-
42
-
43
-
44
-
45
-
46
-
47
-
48
-
49
-
50
-
51
-
52
-
53
-
54
-
55
-
56
-
57
-
58
-
59
-
60
-
61
-
62
-
63
-
64
-
65
-
66
-
67
-
68
-
69
-
70
-
71
-
72
-
73
-
74
-
75
-
76
-
77
-
78
-
79
-
80
-
81
-
82
-
83
-
84
-
85
-
86
-
87
-
88
-
89
-
90
-
91
-
92
-
93
-
94
-
95
-
96
-
97
-
98
-
99
-
100
-
101
-
102
-
103
-
104
-
105
-
106
-
107
-
108
-
109
-
110
-
111
-
112
-
113
-
114
-
115
-
116
-
117
-
118
-
119
-
120
-
121
-
122
-
123
-
124
-
125
-
126
-
127
-
128
-
129
-
130
-
131
-
132
-
133
-
134
-
135
-
136
-
137
-
138
-
139
-
140
-
141
-
142
-
143
-
144
-
145
-
146
-
147
-
148
-
149
-
150
-
151
-
152
-
153
-
154
-
155
-
156
-
157
-
158
-
159
-
160
-
161
-
162
-
163
-
164
-
165
-
166
-
167
-
168
-
169
-
170
-
171
-
172
-
173
-
174
-
175
-
176
-
177
-
178
-
179
-
180
-
181
-
182
-
183
-
184
-
185
-
186
-
187
-
188
-
189
-
190
-
191
-
192
-
193
-
194
-
195
-
196
-
197
-
198
-
199
-
200
-
201
-
202
-
203
-
204
-
205
-
206
-
207
-
208
-
209
-
210
-
211
-
212
-
213
-
214
-
215
-
216
-
217
-
218
-
219
-
220
-
221
-
222
-
223
-
224
-
225
-
226
-
227
-
228
-
229
-
230
-
231
-
232
-
233
-
234
-
235
-
236
-
237
-
238
-
239
-
240
-
241
-
242
-
243
-
244
-
245
-
246
-
247
-
248
-
249
-
250
-
251
-
252
-
253
-
254
-
255
-
256
-
257
-
 258
258 -
 259
259 -
 260
260 -
 261
261 -
 262
262 -
 263
263 -
 264
264 -
 265
265 -
 266
266 -
 267
267 -
 268
268 -
 269
269 -
 270
270 -
 271
271 -
 272
272 -
 273
273 -
 274
274 -
 275
275 -
 276
276 -
 277
277 -
 278
278 -
279
-
280
-
281
-
282
-
283
-
284
-
285
-
286
-
287
-
288
-
289
-
290
-
291
-
292
-
293
-
294
-
295
-
296
-
297
-
298
-
299
-
300
-
301
-
302
-
303
-
304
-
305
-
306
-
307
-
308
-
309
-
310
-
311
-
312
-
313
-
314
-
315
-
316
-
317
-
318
-
319
-
320
-
321
-
322
-
323
-
324
-
325
-
326
-
327
-
328
-
329
-
330
-
331
-
332
-
333
-
334
-
335
-
336
-
337
-
338
-
339
-
340
-
341
-
342
 |
 |

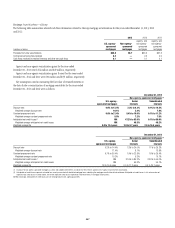
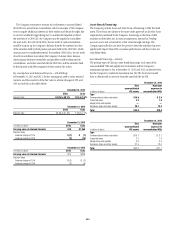
250
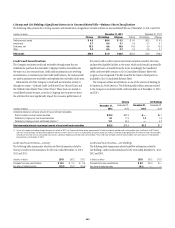
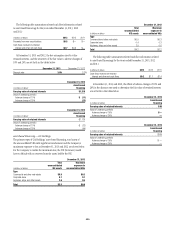
December 31, 2013
Non-agency-sponsored mortgages (1)
U.S. agency-
sponsored mortgages
Senior
interests
Subordinated
interests (2)
Discount rate 0.0% to 49.3% 9.9% —
Weighted average discount rate 9.5% 9.9% —
Constant prepayment rate 9.6% to 26.2% 12.3% to 27.3% —
Weighted average constant prepayment rate 20.0% 15.6% —
Anticipated net credit losses NM 0.3% —
Weighted average anticipated net credit losses NM 0.3% —
Weighted average life 2.3 to 7.6 years 5.2 years —
December 31, 2012
Non-agency-sponsored mortgages (1)
U.S. agency-
sponsored mortgages
Senior
interests
Subordinated
interests
Discount rate 0.0% to 52.7 % 4.1% to 29.2 % 3.4% to 12.4%
Weighted average discount rate 9.7 % 4.2 % 8.0%
Constant prepayment rate 8.2% to 37.4 % 21.7% to 26.0 % 12.7% to 18.7%
Weighted average constant prepayment rate 28.6% 21.7 % 15.7%
Anticipated net credit losses NM 0.5 % 50.0% to 50.1%
Weighted average anticipated net credit losses NM 0.5 % 50.1%
Weighted average life 2.2 to 7.8 years 2.1 to 4.4 years 6.0 to 7.4 years
(1) Disclosure of non-agency-sponsored mortgages as senior and subordinated interests is indicative of the interests’ position in the capital structure of the securitization.
(2) Citi Holdings held no subordinated interests in mortgage securitizations as of December 31, 2013.
NM Not meaningful. Anticipated net credit losses are not meaningful due to U.S. agency guarantees.
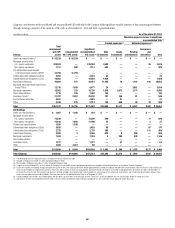
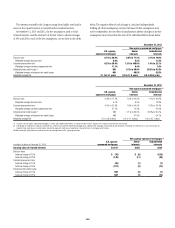
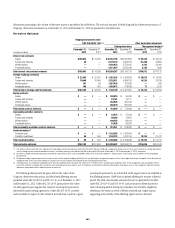
In millions of dollars at December 31, 2013
U.S. agency-
sponsored mortgages
Non-agency-sponsored mortgages (1)
Senior
interests
Subordinated
interests
Carrying value of retained interests $585 $ 50 $—
Discount rates
Adverse change of 10% $ (16) $ (3) $—
Adverse change of 20% (32) (5) —
Constant prepayment rate
Adverse change of 10% (33) (3) —
Adverse change of 20% (65) (6) —
Anticipated net credit losses
Adverse change of 10% NM (5) —
Adverse change of 20% NM (11) —
In millions of dollars at December 31, 2012
U.S. agency-
sponsored mortgages
Non-agency-sponsored mortgages (1)
Senior
interests
Subordinated
interests
Carrying value of retained interests $ 618 $ 39 $16
Discount rates
Adverse change of 10% $ (22) $ — $ (1)
Adverse change of 20% (42) (1) (2)
Constant prepayment rate
Adverse change of 10% (57) (3) —
Adverse change of 20% (109) (7) (1)
Anticipated net credit losses
Adverse change of 10% NM (9) (2)
Adverse change of 20% NM (19) (4)
(1) Disclosure of non-agency-sponsored mortgages as senior and subordinated interests is indicative of the interests’ position in the capital structure of the securitization.
NM Not meaningful. Anticipated net credit losses are not meaningful due to U.S. agency guarantees.