Citibank 2013 Annual Report Download - page 39
Download and view the complete annual report
Please find page 39 of the 2013 Citibank annual report below. You can navigate through the pages in the report by either clicking on the pages listed below, or by using the keyword search tool below to find specific information within the annual report.-
 1
1 -
2
-
3
-
4
-
5
-
6
-
7
-
8
-
9
-
10
-
11
-
12
-
13
-
14
-
15
-
16
-
17
-
18
-
19
-
20
-
21
-
22
-
23
-
24
-
25
-
26
-
27
-
28
-
 29
29 -
 30
30 -
 31
31 -
 32
32 -
 33
33 -
 34
34 -
 35
35 -
 36
36 -
 37
37 -
 38
38 -
 39
39 -
 40
40 -
 41
41 -
 42
42 -
 43
43 -
 44
44 -
 45
45 -
 46
46 -
 47
47 -
 48
48 -
 49
49 -
50
-
51
-
52
-
53
-
54
-
55
-
56
-
57
-
58
-
59
-
60
-
61
-
62
-
63
-
64
-
65
-
66
-
67
-
68
-
69
-
70
-
71
-
72
-
73
-
74
-
75
-
76
-
77
-
78
-
79
-
80
-
81
-
82
-
83
-
84
-
85
-
86
-
87
-
88
-
89
-
90
-
91
-
92
-
93
-
94
-
95
-
96
-
97
-
98
-
99
-
100
-
101
-
102
-
103
-
104
-
105
-
106
-
107
-
108
-
109
-
110
-
111
-
112
-
113
-
114
-
115
-
116
-
117
-
118
-
119
-
120
-
121
-
122
-
123
-
124
-
125
-
126
-
127
-
128
-
129
-
130
-
131
-
132
-
133
-
134
-
135
-
136
-
137
-
138
-
139
-
140
-
141
-
142
-
143
-
144
-
145
-
146
-
147
-
148
-
149
-
150
-
151
-
152
-
153
-
154
-
155
-
156
-
157
-
158
-
159
-
160
-
161
-
162
-
163
-
164
-
165
-
166
-
167
-
168
-
169
-
170
-
171
-
172
-
173
-
174
-
175
-
176
-
177
-
178
-
179
-
180
-
181
-
182
-
183
-
184
-
185
-
186
-
187
-
188
-
189
-
190
-
191
-
192
-
193
-
194
-
195
-
196
-
197
-
198
-
199
-
200
-
201
-
202
-
203
-
204
-
205
-
206
-
207
-
208
-
209
-
210
-
211
-
212
-
213
-
214
-
215
-
216
-
217
-
218
-
219
-
220
-
221
-
222
-
223
-
224
-
225
-
226
-
227
-
228
-
229
-
230
-
231
-
232
-
233
-
234
-
235
-
236
-
237
-
238
-
239
-
240
-
241
-
242
-
243
-
244
-
245
-
246
-
247
-
248
-
249
-
250
-
251
-
252
-
253
-
254
-
255
-
256
-
257
-
258
-
259
-
260
-
261
-
262
-
263
-
264
-
265
-
266
-
267
-
268
-
269
-
270
-
271
-
272
-
273
-
274
-
275
-
276
-
277
-
278
-
279
-
280
-
281
-
282
-
283
-
284
-
285
-
286
-
287
-
288
-
289
-
290
-
291
-
292
-
293
-
294
-
295
-
296
-
297
-
298
-
299
-
300
-
301
-
302
-
303
-
304
-
305
-
306
-
307
-
308
-
309
-
310
-
311
-
312
-
313
-
314
-
315
-
316
-
317
-
318
-
319
-
320
-
321
-
322
-
323
-
324
-
325
-
326
-
327
-
328
-
329
-
330
-
331
-
332
-
333
-
334
-
335
-
336
-
337
-
338
-
339
-
340
-
341
-
342
 |
 |
21
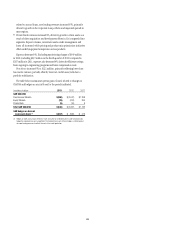
The discussion of the results of operations for EMEA RCB below excludes the impact of FX translation for all periods presented. Presentation of the results
of operations, excluding the impact of FX translation, are non-GAAP financial measures. Citi believes the presentation of EMEA RCB’s results excluding
the impact of FX translation is a more meaningful depiction of the underlying fundamentals of the business. For a reconciliation of certain of these
metrics to the reported results, see the table above.
2013 vs. 2012
Net income of $48 million compared to a net loss of $36 million in 2012
as lower expenses and lower net credit losses were partially offset by lower
revenues, primarily due to the sales of Citi’s consumer operations in Turkey
and Romania during 2013.
Revenues decreased 1%, mainly driven by the lower revenues resulting
from the sales of the consumer operations referenced above, partially offset by
higher volumes in core markets and a gain on sale related to the Turkey sale.
Net interest revenue decreased 5%, due to continued spread compression in
cards and an 8% decrease in average cards loans, primarily due to the sales
in Turkey and Romania, partially offset by growth in average retail loans of
13%. Interest rate caps on credit cards, particularly in Poland, the continued
liquidation of a higher yielding non-strategic retail banking portfolio and
the continued low interest rate environment were the main contributors to
the lower net interest spreads. Citi expects continued regulatory changes,
including caps on interchange rates, and spread compression to continue
to negatively impact revenues in this business during 2014. Non-interest
revenue increased 6%, mainly reflecting higher investment fees and card
fees due to increased sales volume and the gain on sale related to Turkey,
partially offset by lower revenues due to the sales in Turkey and Romania.
Cards purchase sales decreased 4% and investment sales decreased 5% due to
the sales in Turkey and Romania. Excluding the impact of these divestitures,
cards purchase sales increased 9% and investment sales increased 12%.
Expenses declined 6%, primarily due to repositioning savings as well
as lower repositioning charges, partially offset by higher volume-related
expenses and continued investment spending on new internal operating
platforms.
Provisions declined 49% due to a 35% decrease in net credit losses largely
resulting from the sales in Turkey and Romania and a net credit recovery in
the second quarter 2013. Net credit losses also continued to reflect stabilizing
credit quality and Citi’s strategic move toward lower-risk customers.
2012 vs. 2011
The net loss of $36 million compared to net income of $80 million in 2011
and was mainly due to higher expenses and lower loan loss reserve releases,
partially offset by higher revenues.
Revenues increased 2%, with growth across the major products,
particularly in Russia. Year-over-year, cards purchase sales increased 12%,
investment sales increased 15% and retail loan volume increased 17%.
Revenue growth year-over-year was partly offset by the absence of Akbank
T.A.S. (Akbank), Citi’s equity investment in Turkey, which was moved to
Corporate/Other in the first quarter of 2012. Net interest revenue increased
18%, driven by the absence of Akbank investment funding costs and growth
in average deposits of 5%, average retail loans of 16% and average cards
loans of 6%, partially offset by spread compression. Interest rate caps on
credit cards, particularly in Turkey and Poland, the continued liquidation of
the higher yielding non-strategic retail banking portfolio and the continued
low interest rate environment were the main contributors to the lower net
interest spreads. Non-interest revenue decreased 20%, mainly reflecting the
absence of Akbank.
Expenses increased 13%, primarily due to $57 million of fourth quarter of
2012 repositioning charges in Turkey, Romania and Pakistan and the impact
of continued investment spending on new internal operating platforms
during 2012.
Provisions increased $43 million due to lower loan loss reserve releases,
partially offset by lower net credit losses across most countries. Net credit
losses decreased 36% due to the ongoing improvement in credit quality and
the move toward lower-risk customers.