Citibank 2013 Annual Report Download - page 310
Download and view the complete annual report
Please find page 310 of the 2013 Citibank annual report below. You can navigate through the pages in the report by either clicking on the pages listed below, or by using the keyword search tool below to find specific information within the annual report.-
 1
1 -
2
-
3
-
4
-
5
-
6
-
7
-
8
-
9
-
10
-
11
-
12
-
13
-
14
-
15
-
16
-
17
-
18
-
19
-
20
-
21
-
22
-
23
-
24
-
25
-
26
-
27
-
28
-
29
-
30
-
31
-
32
-
33
-
34
-
35
-
36
-
37
-
38
-
39
-
40
-
41
-
42
-
43
-
44
-
45
-
46
-
47
-
48
-
49
-
50
-
51
-
52
-
53
-
54
-
55
-
56
-
57
-
58
-
59
-
60
-
61
-
62
-
63
-
64
-
65
-
66
-
67
-
68
-
69
-
70
-
71
-
72
-
73
-
74
-
75
-
76
-
77
-
78
-
79
-
80
-
81
-
82
-
83
-
84
-
85
-
86
-
87
-
88
-
89
-
90
-
91
-
92
-
93
-
94
-
95
-
96
-
97
-
98
-
99
-
100
-
101
-
102
-
103
-
104
-
105
-
106
-
107
-
108
-
109
-
110
-
111
-
112
-
113
-
114
-
115
-
116
-
117
-
118
-
119
-
120
-
121
-
122
-
123
-
124
-
125
-
126
-
127
-
128
-
129
-
130
-
131
-
132
-
133
-
134
-
135
-
136
-
137
-
138
-
139
-
140
-
141
-
142
-
143
-
144
-
145
-
146
-
147
-
148
-
149
-
150
-
151
-
152
-
153
-
154
-
155
-
156
-
157
-
158
-
159
-
160
-
161
-
162
-
163
-
164
-
165
-
166
-
167
-
168
-
169
-
170
-
171
-
172
-
173
-
174
-
175
-
176
-
177
-
178
-
179
-
180
-
181
-
182
-
183
-
184
-
185
-
186
-
187
-
188
-
189
-
190
-
191
-
192
-
193
-
194
-
195
-
196
-
197
-
198
-
199
-
200
-
201
-
202
-
203
-
204
-
205
-
206
-
207
-
208
-
209
-
210
-
211
-
212
-
213
-
214
-
215
-
216
-
217
-
218
-
219
-
220
-
221
-
222
-
223
-
224
-
225
-
226
-
227
-
228
-
229
-
230
-
231
-
232
-
233
-
234
-
235
-
236
-
237
-
238
-
239
-
240
-
241
-
242
-
243
-
244
-
245
-
246
-
247
-
248
-
249
-
250
-
251
-
252
-
253
-
254
-
255
-
256
-
257
-
258
-
259
-
260
-
261
-
262
-
263
-
264
-
265
-
266
-
267
-
268
-
269
-
270
-
271
-
272
-
273
-
274
-
275
-
276
-
277
-
278
-
279
-
280
-
281
-
282
-
283
-
284
-
285
-
286
-
287
-
288
-
289
-
290
-
291
-
292
-
293
-
294
-
295
-
296
-
297
-
298
-
299
-
 300
300 -
 301
301 -
 302
302 -
 303
303 -
 304
304 -
 305
305 -
 306
306 -
 307
307 -
 308
308 -
 309
309 -
 310
310 -
 311
311 -
 312
312 -
 313
313 -
 314
314 -
 315
315 -
 316
316 -
 317
317 -
 318
318 -
 319
319 -
 320
320 -
321
-
322
-
323
-
324
-
325
-
326
-
327
-
328
-
329
-
330
-
331
-
332
-
333
-
334
-
335
-
336
-
337
-
338
-
339
-
340
-
341
-
342
 |
 |

292
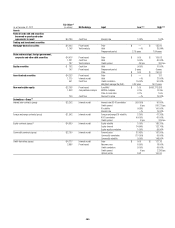
26. FAIR VALUE ELECTIONS
The Company may elect to report most financial instruments and certain
other items at fair value on an instrument-by-instrument basis with changes
in fair value reported in earnings. The election is made upon the acquisition
of an eligible financial asset, financial liability or firm commitment or when
certain specified reconsideration events occur. The fair value election may not
be revoked once an election is made. The changes in fair value are recorded
in current earnings. Additional discussion regarding the applicable areas in
which fair value elections were made is presented in Note 25 to the Consolidated
Financial Statements.
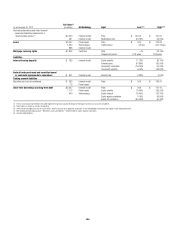
All servicing rights are recognized initially at fair value. The Company has
elected fair value accounting for its mortgage servicing rights. See Note 22 to
the Consolidated Financial Statements for further discussions regarding the
accounting and reporting of MSRs.
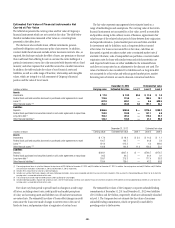
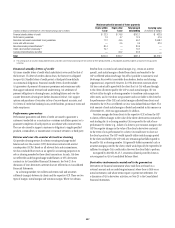
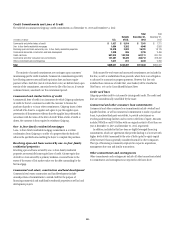
The following table presents, as of December 31, 2013 and 2012, the
changes in fair value gains and losses for the years ended December 31,
2013 and 2012 associated with those items for which the fair value option
was elected:
Changes in fair value gains
(losses) for the years
ended December 31,
In millions of dollars 2013 2012
Assets
Federal funds sold and securities borrowed or purchased under agreements to resell
Selected portfolios of securities purchased under agreements to resell and securities borrowed $ (628) $ (409)
Trading account assets (190) 836
Investments (39) (50)
Loans
Certain Corporate loans (1) 72 77
Certain Consumer loans (1) (155) (104)
Total loans $ (83) $ (27)
Other assets
MSRs $ 553 $ (427)
Certain mortgage loans held for sale (2) 951 2,514
Certain equity method investments (9) 3
Total other assets $1,495 $ 2,090
Total assets $ 555 $ 2,440
Liabilities
Interest-bearing deposits $ 166 $ (218)
Federal funds purchased and securities loaned or sold under agreements to repurchase
Selected portfolios of securities sold under agreements to repurchase and securities loaned 110 66
Trading account liabilities 30 (143)
Short-term borrowings 76 145
Long-term debt 113 (2,008)
Total liabilities $ 495 $(2,158)
(1) Includes mortgage loans held by mortgage loan securitization VIEs consolidated upon the adoption of ASC 810 Consolidation (SFAS 167) on January 1, 2010.
(2) Includes gains (losses) associated with interest rate lock-commitments for those loans that have been originated and elected under the fair value option.
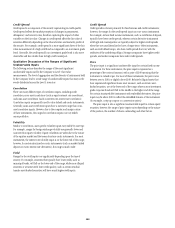
Own Debt Valuation Adjustments
Own debt valuation adjustments are recognized on Citi’s liabilities for
which the fair value option has been elected using Citi’s credit spreads
observed in the bond market. The fair value of liabilities for which the fair
value option is elected (other than non-recourse and similar liabilities) is
impacted by the narrowing or widening of the Company’s credit spreads. The
estimated change in the fair value of these liabilities due to such changes
in the Company’s own credit risk (or instrument-specific credit risk) was a
loss of $410 million and $2,009 million for the years ended December 31,
2013 and 2012, respectively. Changes in fair value resulting from changes
in instrument-specific credit risk were estimated by incorporating the
Company’s current credit spreads observable in the bond market into the
relevant valuation technique used to value each liability as described above.