Citibank 2013 Annual Report Download - page 201
Download and view the complete annual report
Please find page 201 of the 2013 Citibank annual report below. You can navigate through the pages in the report by either clicking on the pages listed below, or by using the keyword search tool below to find specific information within the annual report.-
 1
1 -
2
-
3
-
4
-
5
-
6
-
7
-
8
-
9
-
10
-
11
-
12
-
13
-
14
-
15
-
16
-
17
-
18
-
19
-
20
-
21
-
22
-
23
-
24
-
25
-
26
-
27
-
28
-
29
-
30
-
31
-
32
-
33
-
34
-
35
-
36
-
37
-
38
-
39
-
40
-
41
-
42
-
43
-
44
-
45
-
46
-
47
-
48
-
49
-
50
-
51
-
52
-
53
-
54
-
55
-
56
-
57
-
58
-
59
-
60
-
61
-
62
-
63
-
64
-
65
-
66
-
67
-
68
-
69
-
70
-
71
-
72
-
73
-
74
-
75
-
76
-
77
-
78
-
79
-
80
-
81
-
82
-
83
-
84
-
85
-
86
-
87
-
88
-
89
-
90
-
91
-
92
-
93
-
94
-
95
-
96
-
97
-
98
-
99
-
100
-
101
-
102
-
103
-
104
-
105
-
106
-
107
-
108
-
109
-
110
-
111
-
112
-
113
-
114
-
115
-
116
-
117
-
118
-
119
-
120
-
121
-
122
-
123
-
124
-
125
-
126
-
127
-
128
-
129
-
130
-
131
-
132
-
133
-
134
-
135
-
136
-
137
-
138
-
139
-
140
-
141
-
142
-
143
-
144
-
145
-
146
-
147
-
148
-
149
-
150
-
151
-
152
-
153
-
154
-
155
-
156
-
157
-
158
-
159
-
160
-
161
-
162
-
163
-
164
-
165
-
166
-
167
-
168
-
169
-
170
-
171
-
172
-
173
-
174
-
175
-
176
-
177
-
178
-
179
-
180
-
181
-
182
-
183
-
184
-
185
-
186
-
187
-
188
-
189
-
190
-
 191
191 -
 192
192 -
 193
193 -
 194
194 -
 195
195 -
 196
196 -
 197
197 -
 198
198 -
 199
199 -
 200
200 -
 201
201 -
 202
202 -
 203
203 -
 204
204 -
 205
205 -
 206
206 -
 207
207 -
 208
208 -
 209
209 -
 210
210 -
 211
211 -
212
-
213
-
214
-
215
-
216
-
217
-
218
-
219
-
220
-
221
-
222
-
223
-
224
-
225
-
226
-
227
-
228
-
229
-
230
-
231
-
232
-
233
-
234
-
235
-
236
-
237
-
238
-
239
-
240
-
241
-
242
-
243
-
244
-
245
-
246
-
247
-
248
-
249
-
250
-
251
-
252
-
253
-
254
-
255
-
256
-
257
-
258
-
259
-
260
-
261
-
262
-
263
-
264
-
265
-
266
-
267
-
268
-
269
-
270
-
271
-
272
-
273
-
274
-
275
-
276
-
277
-
278
-
279
-
280
-
281
-
282
-
283
-
284
-
285
-
286
-
287
-
288
-
289
-
290
-
291
-
292
-
293
-
294
-
295
-
296
-
297
-
298
-
299
-
300
-
301
-
302
-
303
-
304
-
305
-
306
-
307
-
308
-
309
-
310
-
311
-
312
-
313
-
314
-
315
-
316
-
317
-
318
-
319
-
320
-
321
-
322
-
323
-
324
-
325
-
326
-
327
-
328
-
329
-
330
-
331
-
332
-
333
-
334
-
335
-
336
-
337
-
338
-
339
-
340
-
341
-
342
 |
 |

183
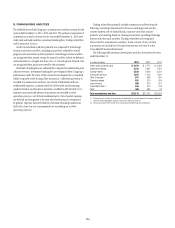
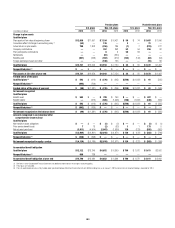
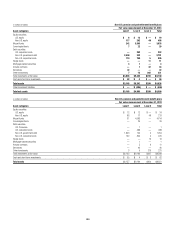
Pension plans Postretirement plans
U.S. plans Non-U.S. plans U.S. plans Non-U.S. plans
In millions of dollars 2013 2012 2013 2012 2013 2012 2013 2012
Change in plan assets
Qualified plans
Plan assets at fair value at beginning of year $12,656 $11,991 $ 7,154 $ 6,421 $ 50 $ 74 $1,497 $1,096
Cumulative effect of change in accounting policy (1) (53) —126 —3—21 —
Actual return on plan assets 789 1,303 (256) 786 (1) 7(223) 277
Company contributions ——357 352 52 54 256 92
Plan participants contributions ——6650 58 ——
Settlements ——(61) (254) ————
Benefits paid (661) (638) (302) (312) (122) (143) (64) (54)
Foreign exchange impact and other ——(106) 155 ——(15) 86
Qualified plans $12,731 $12,656 $ 6,918 $ 7,154 $ 32 $ 50 $1,472 $1,497
Nonqualified plans (2) $ — $ — $ — $ — $ — $ — $ — $ —
Plan assets at fair value at year end $12,731 $12,656 $ 6,918 $ 7,154 $ 32 $ 50 $1,472 $1,497
Funded status of the plans
Qualified plans (3) $ 593 $ (612) $ (276) $ (245) $(748) $(1,022) $ 61 (505)
Nonqualified plans (2) (692) (769) ——————
Funded status of the plans at year end $ (99) $ (1,381) $ (276) $ (245) $(748) $(1,022) $ 61 $ (505)
Net amount recognized
Qualified plans
Benefit asset $ 593 $ — $ 709 $ 763 $ — $ — $ 407 $ —
Benefit liability —(612) (985) (1,008) (748) (1,022) (346) (505)
Qualified plans $ 593 $ (612) $ (276) $ (245) $(748) $(1,022) $ 61 $ (505)
Nonqualified plans (2) $ (692) $ (769) $ — $ — $ — $ — $ — $ —
Net amount recognized on the balance sheet $ (99) $ (1,381) $ (276) $ (245) $(748) $ (1,022) $ 61 $ (505)
Amounts recognized in Accumulated other
comprehensive income (loss)
Qualified plans
Net transition asset (obligation) $ — $ — $ (1) $ (2) $ — $ — $ (1) $ (1)
Prior service benefit (cost) 713 (2) (33) 11173 5
Net actuarial gain (loss) (3,911) (4,904) (2,007) (1,936) 129 (123) (555) (802)
Qualified plans $ (3,904) $ (4,891) $(2,010) $(1,971) $ 130 $ (122) $(383) $ (798)
Nonqualified plans (2) $ (226) $ (298) $ — $ — $ — $ — $ — $ —
Net amount recognized in equity—pretax $ (4,130) $ (5,189) $(2,010) $(1,971) $ 130 $ (122) $ (383) $ (798)
Accumulated benefit obligation
Qualified plans $12,122 $13,246 $ 6,652 $ 6,369 $ 780 $ 1,072 $1,411 $2,002
Nonqualified plans (2) 668 738 ——————
Accumulated benefit obligation at year end $12,790 $13,984 $ 6,652 $ 6,369 $ 780 $ 1,072 $1,411 $2,002
(1) See Note 1 to the Consolidated Financial Statements for additional information on the change in accounting policy.
(2) These plans are unfunded.
(3) The U.S. qualified pension plan is fully funded under specified Employee Retirement Income Security Act (ERISA) funding rules as of January 1, 2014 and no minimum required funding is expected for 2014.