Citibank 2013 Annual Report Download - page 284
Download and view the complete annual report
Please find page 284 of the 2013 Citibank annual report below. You can navigate through the pages in the report by either clicking on the pages listed below, or by using the keyword search tool below to find specific information within the annual report.-
 1
1 -
2
-
3
-
4
-
5
-
6
-
7
-
8
-
9
-
10
-
11
-
12
-
13
-
14
-
15
-
16
-
17
-
18
-
19
-
20
-
21
-
22
-
23
-
24
-
25
-
26
-
27
-
28
-
29
-
30
-
31
-
32
-
33
-
34
-
35
-
36
-
37
-
38
-
39
-
40
-
41
-
42
-
43
-
44
-
45
-
46
-
47
-
48
-
49
-
50
-
51
-
52
-
53
-
54
-
55
-
56
-
57
-
58
-
59
-
60
-
61
-
62
-
63
-
64
-
65
-
66
-
67
-
68
-
69
-
70
-
71
-
72
-
73
-
74
-
75
-
76
-
77
-
78
-
79
-
80
-
81
-
82
-
83
-
84
-
85
-
86
-
87
-
88
-
89
-
90
-
91
-
92
-
93
-
94
-
95
-
96
-
97
-
98
-
99
-
100
-
101
-
102
-
103
-
104
-
105
-
106
-
107
-
108
-
109
-
110
-
111
-
112
-
113
-
114
-
115
-
116
-
117
-
118
-
119
-
120
-
121
-
122
-
123
-
124
-
125
-
126
-
127
-
128
-
129
-
130
-
131
-
132
-
133
-
134
-
135
-
136
-
137
-
138
-
139
-
140
-
141
-
142
-
143
-
144
-
145
-
146
-
147
-
148
-
149
-
150
-
151
-
152
-
153
-
154
-
155
-
156
-
157
-
158
-
159
-
160
-
161
-
162
-
163
-
164
-
165
-
166
-
167
-
168
-
169
-
170
-
171
-
172
-
173
-
174
-
175
-
176
-
177
-
178
-
179
-
180
-
181
-
182
-
183
-
184
-
185
-
186
-
187
-
188
-
189
-
190
-
191
-
192
-
193
-
194
-
195
-
196
-
197
-
198
-
199
-
200
-
201
-
202
-
203
-
204
-
205
-
206
-
207
-
208
-
209
-
210
-
211
-
212
-
213
-
214
-
215
-
216
-
217
-
218
-
219
-
220
-
221
-
222
-
223
-
224
-
225
-
226
-
227
-
228
-
229
-
230
-
231
-
232
-
233
-
234
-
235
-
236
-
237
-
238
-
239
-
240
-
241
-
242
-
243
-
244
-
245
-
246
-
247
-
248
-
249
-
250
-
251
-
252
-
253
-
254
-
255
-
256
-
257
-
258
-
259
-
260
-
261
-
262
-
263
-
264
-
265
-
266
-
267
-
268
-
269
-
270
-
271
-
272
-
273
-
 274
274 -
 275
275 -
 276
276 -
 277
277 -
 278
278 -
 279
279 -
 280
280 -
 281
281 -
 282
282 -
 283
283 -
 284
284 -
 285
285 -
 286
286 -
 287
287 -
 288
288 -
 289
289 -
 290
290 -
 291
291 -
 292
292 -
 293
293 -
 294
294 -
295
-
296
-
297
-
298
-
299
-
300
-
301
-
302
-
303
-
304
-
305
-
306
-
307
-
308
-
309
-
310
-
311
-
312
-
313
-
314
-
315
-
316
-
317
-
318
-
319
-
320
-
321
-
322
-
323
-
324
-
325
-
326
-
327
-
328
-
329
-
330
-
331
-
332
-
333
-
334
-
335
-
336
-
337
-
338
-
339
-
340
-
341
-
342
 |
 |

266
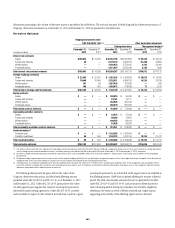
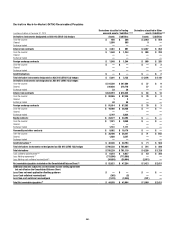
The following table summarizes the gains (losses) on the Company’s fair value hedges for the years ended December 31, 2013, 2012 and 2011:
Gains (losses) on fair value hedges
Year ended December 31,
(1)
In millions of dollars 2013 2012 2011
Gain (loss) on derivatives in designated and qualifying fair value hedges
Interest rate contracts $(3,288) $ 122 $ 4,423
Foreign exchange contracts 265 377 (117)
Total gain (loss) on the derivatives in designated and qualifying fair value hedges $(3,023) $ 499 $ 4,306
Gain (loss) on the hedged item in designated and qualifying fair value hedges
Interest rate hedges $ 3,204 $(371) $(4,296)
Foreign exchange hedges (185) (331) 26
Total gain (loss) on the hedged item in designated and qualifying fair value hedges $ 3,019 $(702) $(4,270)
Hedge ineffectiveness recognized in earnings on designated and qualifying fair value hedges
Interest rate hedges $ (84) $(249) $ 118
Foreign exchange hedges (4) 16 1
Total hedge ineffectiveness recognized in earnings on designated and qualifying fair value hedges $ (88) $(233) $ 119
Net gain (loss) excluded from assessment of the effectiveness of fair value hedges
Interest rate contracts $ — $ — $ 9
Foreign exchange contracts (2) 84 30 (92)
Total net gain (loss) excluded from assessment of the effectiveness of fair value hedges $ 84 $ 30 $ (83)
(1) Amounts are included in Other revenue on the Consolidated Statement of Income. The accrued interest income on fair value hedges is recorded in Net interest revenue and is excluded from this table.
(2) Amounts relate to the premium associated with forward contracts (differential between spot and contractual forward rates). These amounts are excluded from the assessment of hedge effectiveness and reflected
directly in earnings.
Cash Flow Hedges
Hedging of benchmark interest rate risk
Citigroup hedges variable cash flows resulting from floating-rate liabilities
and rollover (re-issuance) of liabilities. Variable cash flows from those
liabilities are converted to fixed-rate cash flows by entering into receive-
variable, pay-fixed interest rate swaps and receive-variable, pay-fixed
forward-starting interest rate swaps. Citi also hedges variable cash flows from
recognized and forecasted floating-rate assets and origination of short-term
assets. Variable cash flows from those assets are converted to fixed-rate
cash flows by entering into receive-fixed, pay-variable interest rate swaps.
These cash-flow hedging relationships use either regression analysis or
dollar-offset ratio analysis to assess whether the hedging relationships are
highly effective at inception and on an ongoing basis. When certain interest
rates do not qualify as a benchmark interest rate, Citigroup designates the
risk being hedged as the risk of overall changes in the hedged cash flows.
Since efforts are made to match the terms of the derivatives to those of the
hedged forecasted cash flows as closely as possible, the amount of hedge
ineffectiveness is not significant.
Hedging of foreign exchange risk
Citigroup locks in the functional currency equivalent cash flows of long-
term debt and short-term borrowings that are denominated in a currency
other than the functional currency of the issuing entity. Depending on the
risk management objectives, these types of hedges are designated as either
cash flow hedges of only foreign exchange risk or cash flow hedges of both
foreign exchange and interest rate risk, and the hedging instruments used
are foreign exchange cross-currency swaps and forward contracts. These
cash flow hedge relationships use dollar-offset ratio analysis to determine
whether the hedging relationships are highly effective at inception and on an
ongoing basis.
Hedging of overall changes in cash flows
Citigroup hedges the overall exposure to variability in cash flows related
to the future acquisition of mortgage-backed securities using “to be
announced” forward contracts. Since the hedged transaction is the gross
settlement of the forward contract, the assessment of hedge effectiveness is
based on assuring that the terms of the hedging instrument and the hedged
forecasted transaction are the same.
Hedging total return
Citigroup generally manages the risk associated with leveraged loans it
has originated or in which it participates by transferring a majority of its
exposure to the market through SPEs prior to or shortly after funding.
Retained exposures to leveraged loans receivable are generally hedged using
total return swaps.