Citibank 2013 Annual Report Download - page 111
Download and view the complete annual report
Please find page 111 of the 2013 Citibank annual report below. You can navigate through the pages in the report by either clicking on the pages listed below, or by using the keyword search tool below to find specific information within the annual report.-
 1
1 -
2
-
3
-
4
-
5
-
6
-
7
-
8
-
9
-
10
-
11
-
12
-
13
-
14
-
15
-
16
-
17
-
18
-
19
-
20
-
21
-
22
-
23
-
24
-
25
-
26
-
27
-
28
-
29
-
30
-
31
-
32
-
33
-
34
-
35
-
36
-
37
-
38
-
39
-
40
-
41
-
42
-
43
-
44
-
45
-
46
-
47
-
48
-
49
-
50
-
51
-
52
-
53
-
54
-
55
-
56
-
57
-
58
-
59
-
60
-
61
-
62
-
63
-
64
-
65
-
66
-
67
-
68
-
69
-
70
-
71
-
72
-
73
-
74
-
75
-
76
-
77
-
78
-
79
-
80
-
81
-
82
-
83
-
84
-
85
-
86
-
87
-
88
-
89
-
90
-
91
-
92
-
93
-
94
-
95
-
96
-
97
-
98
-
99
-
100
-
 101
101 -
 102
102 -
 103
103 -
 104
104 -
 105
105 -
 106
106 -
 107
107 -
 108
108 -
 109
109 -
 110
110 -
 111
111 -
 112
112 -
 113
113 -
 114
114 -
 115
115 -
 116
116 -
 117
117 -
 118
118 -
 119
119 -
 120
120 -
 121
121 -
122
-
123
-
124
-
125
-
126
-
127
-
128
-
129
-
130
-
131
-
132
-
133
-
134
-
135
-
136
-
137
-
138
-
139
-
140
-
141
-
142
-
143
-
144
-
145
-
146
-
147
-
148
-
149
-
150
-
151
-
152
-
153
-
154
-
155
-
156
-
157
-
158
-
159
-
160
-
161
-
162
-
163
-
164
-
165
-
166
-
167
-
168
-
169
-
170
-
171
-
172
-
173
-
174
-
175
-
176
-
177
-
178
-
179
-
180
-
181
-
182
-
183
-
184
-
185
-
186
-
187
-
188
-
189
-
190
-
191
-
192
-
193
-
194
-
195
-
196
-
197
-
198
-
199
-
200
-
201
-
202
-
203
-
204
-
205
-
206
-
207
-
208
-
209
-
210
-
211
-
212
-
213
-
214
-
215
-
216
-
217
-
218
-
219
-
220
-
221
-
222
-
223
-
224
-
225
-
226
-
227
-
228
-
229
-
230
-
231
-
232
-
233
-
234
-
235
-
236
-
237
-
238
-
239
-
240
-
241
-
242
-
243
-
244
-
245
-
246
-
247
-
248
-
249
-
250
-
251
-
252
-
253
-
254
-
255
-
256
-
257
-
258
-
259
-
260
-
261
-
262
-
263
-
264
-
265
-
266
-
267
-
268
-
269
-
270
-
271
-
272
-
273
-
274
-
275
-
276
-
277
-
278
-
279
-
280
-
281
-
282
-
283
-
284
-
285
-
286
-
287
-
288
-
289
-
290
-
291
-
292
-
293
-
294
-
295
-
296
-
297
-
298
-
299
-
300
-
301
-
302
-
303
-
304
-
305
-
306
-
307
-
308
-
309
-
310
-
311
-
312
-
313
-
314
-
315
-
316
-
317
-
318
-
319
-
320
-
321
-
322
-
323
-
324
-
325
-
326
-
327
-
328
-
329
-
330
-
331
-
332
-
333
-
334
-
335
-
336
-
337
-
338
-
339
-
340
-
341
-
342
 |
 |

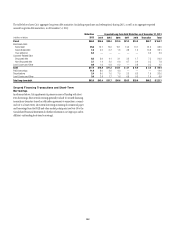
93
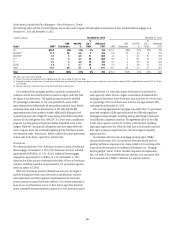
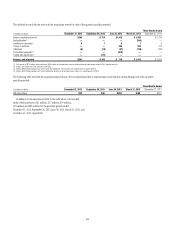
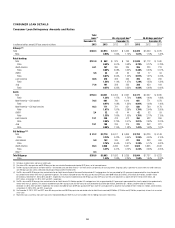
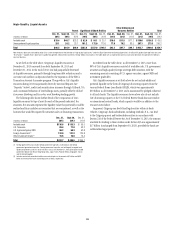
Consumer Loan Net Credit Losses and Ratios
Average
loans (1) Net credit losses (2)
In millions of dollars, except average loan amounts in billions 2013 2013 2012 2011
Citicorp
Total $ 288.0 $ 7,211 $ 8,107 $10,489
Ratio 2.50% 2.87% 3.85%
Retail banking
Total $ 147.6 $ 1,343 $ 1,258 $ 1,190
Ratio 0.91% 0.89% 0.94%
North America 42.7 184 247 302
Ratio 0.43% 0.60% 0.88%
EMEA 5.4 26 46 87
Ratio 0.48% 0.98% 1.98%
Latin America 29.8 844 648 475
Ratio 2.83% 2.46% 2.14%
Asia 69.7 289 317 326
Ratio 0.41% 0.46% 0.50%
Cards
Total $ 140.4 $ 5,868 $ 6,849 $ 9,299
Ratio 4.18% 4.82% 6.39%
North America—Citi-branded 68.6 2,555 3,187 4,668
Ratio 3.72% 4.43% 6.28%
North America—Retail services 38.5 1,895 2,322 3,131
Ratio 4.93% 6.29% 8.13%
EMEA 2.6 42 59 85
Ratio 1.65% 2.09% 2.98%
Latin America 11.7 883 757 858
Ratio 7.56% 7.07% 8.35%
Asia 19.0 493 524 557
Ratio 2.59% 2.65% 2.85%
Citi Holdings
Total $ 100.9 $ 3,051 $ 5,901 $ 7,584
Ratio 3.02% 4.72% 4.69%
International 6.4 217 536 1,057
Ratio 3.38% 5.72% 6.30%
North America (3)(4) 94.5 2,828 5,334 6,447
Ratio 2.99% 4.64% 4.50%
Other (5) 631 80
Total Citigroup $388.9 $10,262 $14,008 $18,073
Ratio 2.64% 3.43% 4.16%
(1) Average loans include interest and fees on credit cards.
(2) The ratios of net credit losses are calculated based on average loans, net of unearned income.
(3) 2012 includes approximately $635 million of incremental charge-offs related to OCC guidance issued in the third quarter of 2012, which required mortgage loans to borrowers that have gone through Chapter 7 of the
U.S. Bankruptcy Code to be written down to collateral value. There was a corresponding approximately $600 million release in the third quarter of 2012 allowance for loan losses related to these charge-offs. 2012 also
includes a benefit to charge-offs of approximately $40 million related to finalizing the impact of the OCC guidance in the fourth quarter of 2012.
(4) 2012 includes approximately $370 million of incremental charge-offs related to previously deferred principal balances on modified mortgages in the first quarter of 2012. These charge-offs were related to anticipated
forgiveness of principal in connection with the national mortgage settlement. There was a corresponding approximately $350 million reserve release in the first quarter of 2012 related to these charge-offs.
(5) Represents NCLs on loans classified as Consumer loans on the Consolidated Balance Sheet that are not included in the Citi Holdings Consumer credit metrics.