Citibank 2013 Annual Report Download - page 64
Download and view the complete annual report
Please find page 64 of the 2013 Citibank annual report below. You can navigate through the pages in the report by either clicking on the pages listed below, or by using the keyword search tool below to find specific information within the annual report.-
 1
1 -
2
-
3
-
4
-
5
-
6
-
7
-
8
-
9
-
10
-
11
-
12
-
13
-
14
-
15
-
16
-
17
-
18
-
19
-
20
-
21
-
22
-
23
-
24
-
25
-
26
-
27
-
28
-
29
-
30
-
31
-
32
-
33
-
34
-
35
-
36
-
37
-
38
-
39
-
40
-
41
-
42
-
43
-
44
-
45
-
46
-
47
-
48
-
49
-
50
-
51
-
52
-
53
-
 54
54 -
 55
55 -
 56
56 -
 57
57 -
 58
58 -
 59
59 -
 60
60 -
 61
61 -
 62
62 -
 63
63 -
 64
64 -
 65
65 -
 66
66 -
 67
67 -
 68
68 -
 69
69 -
 70
70 -
 71
71 -
 72
72 -
 73
73 -
 74
74 -
75
-
76
-
77
-
78
-
79
-
80
-
81
-
82
-
83
-
84
-
85
-
86
-
87
-
88
-
89
-
90
-
91
-
92
-
93
-
94
-
95
-
96
-
97
-
98
-
99
-
100
-
101
-
102
-
103
-
104
-
105
-
106
-
107
-
108
-
109
-
110
-
111
-
112
-
113
-
114
-
115
-
116
-
117
-
118
-
119
-
120
-
121
-
122
-
123
-
124
-
125
-
126
-
127
-
128
-
129
-
130
-
131
-
132
-
133
-
134
-
135
-
136
-
137
-
138
-
139
-
140
-
141
-
142
-
143
-
144
-
145
-
146
-
147
-
148
-
149
-
150
-
151
-
152
-
153
-
154
-
155
-
156
-
157
-
158
-
159
-
160
-
161
-
162
-
163
-
164
-
165
-
166
-
167
-
168
-
169
-
170
-
171
-
172
-
173
-
174
-
175
-
176
-
177
-
178
-
179
-
180
-
181
-
182
-
183
-
184
-
185
-
186
-
187
-
188
-
189
-
190
-
191
-
192
-
193
-
194
-
195
-
196
-
197
-
198
-
199
-
200
-
201
-
202
-
203
-
204
-
205
-
206
-
207
-
208
-
209
-
210
-
211
-
212
-
213
-
214
-
215
-
216
-
217
-
218
-
219
-
220
-
221
-
222
-
223
-
224
-
225
-
226
-
227
-
228
-
229
-
230
-
231
-
232
-
233
-
234
-
235
-
236
-
237
-
238
-
239
-
240
-
241
-
242
-
243
-
244
-
245
-
246
-
247
-
248
-
249
-
250
-
251
-
252
-
253
-
254
-
255
-
256
-
257
-
258
-
259
-
260
-
261
-
262
-
263
-
264
-
265
-
266
-
267
-
268
-
269
-
270
-
271
-
272
-
273
-
274
-
275
-
276
-
277
-
278
-
279
-
280
-
281
-
282
-
283
-
284
-
285
-
286
-
287
-
288
-
289
-
290
-
291
-
292
-
293
-
294
-
295
-
296
-
297
-
298
-
299
-
300
-
301
-
302
-
303
-
304
-
305
-
306
-
307
-
308
-
309
-
310
-
311
-
312
-
313
-
314
-
315
-
316
-
317
-
318
-
319
-
320
-
321
-
322
-
323
-
324
-
325
-
326
-
327
-
328
-
329
-
330
-
331
-
332
-
333
-
334
-
335
-
336
-
337
-
338
-
339
-
340
-
341
-
342
 |
 |
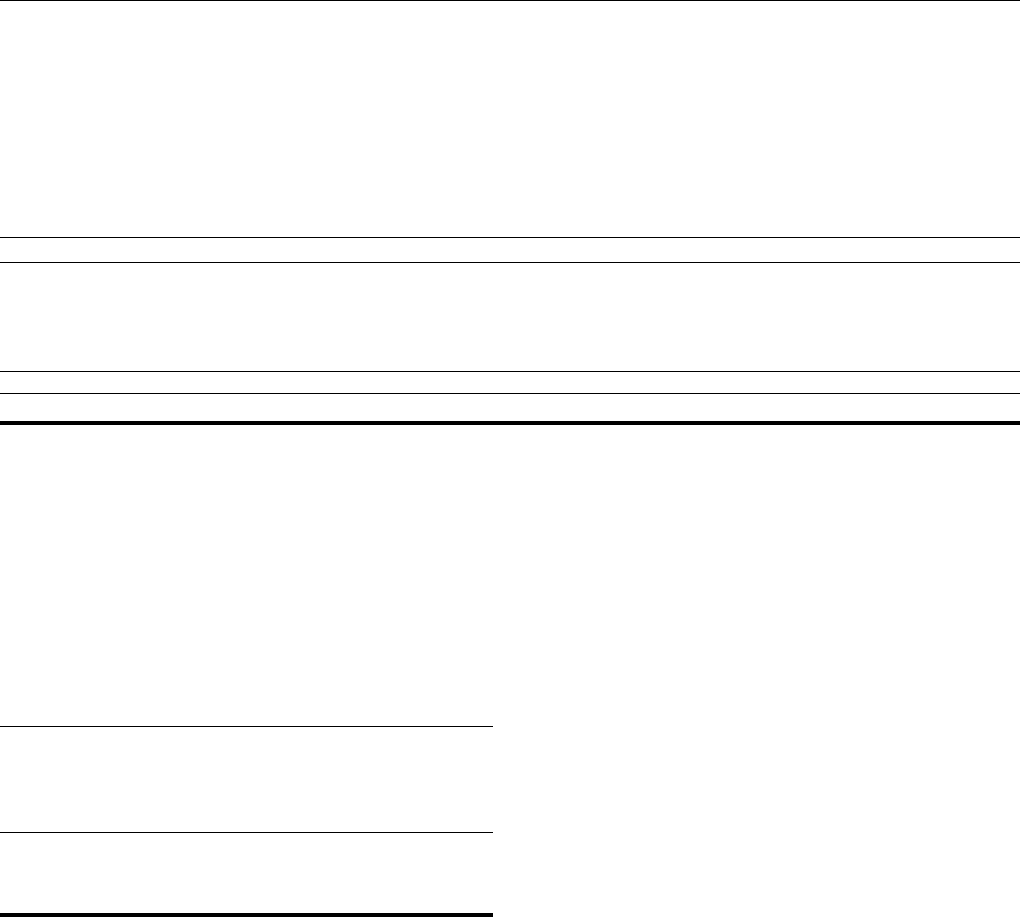
46
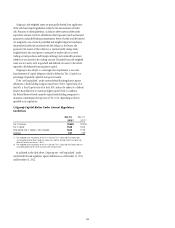
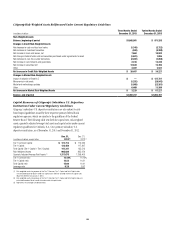
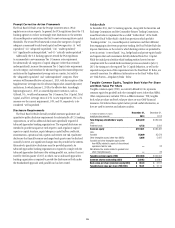
Citigroup Risk-Weighted Assets Rollforward Under Current Regulatory Guidelines
In millions of dollars
Three Months Ended
December 31, 2013
Twelve Months Ended
December 31, 2013
Risk-Weighted Assets
Balance, beginning of period $1,068,991 $ 971,253
Changes in Credit Risk-Weighted Assets
Net decrease in cash and due from banks (1,348) (2,722)
Net decrease in investment securities (558) (3,280)
Net increase in loans and leases, net 7,663 10,502
Net change in federal funds sold and securities purchased under agreements to resell (1,601) 1,095
Net decrease in over-the-counter derivatives (2,202) (1,894)
Net increase in commitments and guarantees 2,316 12,230
Net increase in securities lent 12,820 15,765
Other 3,397 2,531
Net increase in Credit Risk-Weighted Assets $ 20,487 $ 34,227
Changes in Market Risk-Weighted Assets
Impact of adoption of Basel II.5 $ — $ 127,721
Movements in risk levels (1,252) (29,542)
Model and methodology updates (1,988) (22,261)
Other 6,469 11,309
Net increase in Market Risk-Weighted Assets $ 3,229 $ 87,227
Balance, end of period $1,092,707 $1,092,707
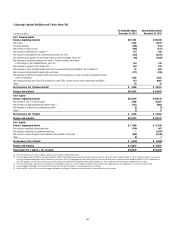
Capital Resources of Citigroup’s Subsidiary U.S. Depository
Institutions Under Current Regulatory Guidelines
Citigroup’s subsidiary U.S. depository institutions are also subject to risk-
based capital guidelines issued by their respective primary federal bank
regulatory agencies, which are similar to the guidelines of the Federal
Reserve Board. The following table sets forth the capital tiers, risk-weighted
assets, quarterly adjusted average total assets and capital ratios under current
regulatory guidelines for Citibank, N.A., Citi’s primary subsidiary U.S.
depository institution, as of December 31, 2013 and December 31, 2012.
In millions of dollars, except ratios
Dec. 31,
2013 (1)
Dec. 31,
2012 (2)
Tier 1 Common Capital $ 121,713 $ 116,633
Tier 1 Capital 122,450 117,367
Total Capital (Tier 1 Capital + Tier 2 Capital) 141,341 135,513
Risk-Weighted Assets 905,836 825,976
Quarterly Adjusted Average Total Assets (3) 1,317,673 1,308,406
Tier 1 Common ratio 13.44% 14.12%
Tier 1 Capital ratio 13.52 14.21
Total Capital ratio 15.60 16.41
Leverage ratio 9.29 8.97
(1) Risk-weighted assets for purposes of the Tier 1 Common, Tier 1 Capital and Total Capital ratios
are calculated based on Basel I credit risk capital rules and final (revised) market risk capital rules
(Basel II.5) effective on January 1, 2013.
(2) Risk-weighted assets for purposes of the Tier 1 Common, Tier 1 Capital and Total Capital ratios are
calculated based on Basel I credit risk and market risk capital rules.
(3) Represents the Leverage ratio denominator.